TurfScore
A three-digit score for every zone on the course. Simple, scientific, numeric, a weighted composite benchmarked against your own historical baseline, updated with every drone flight.
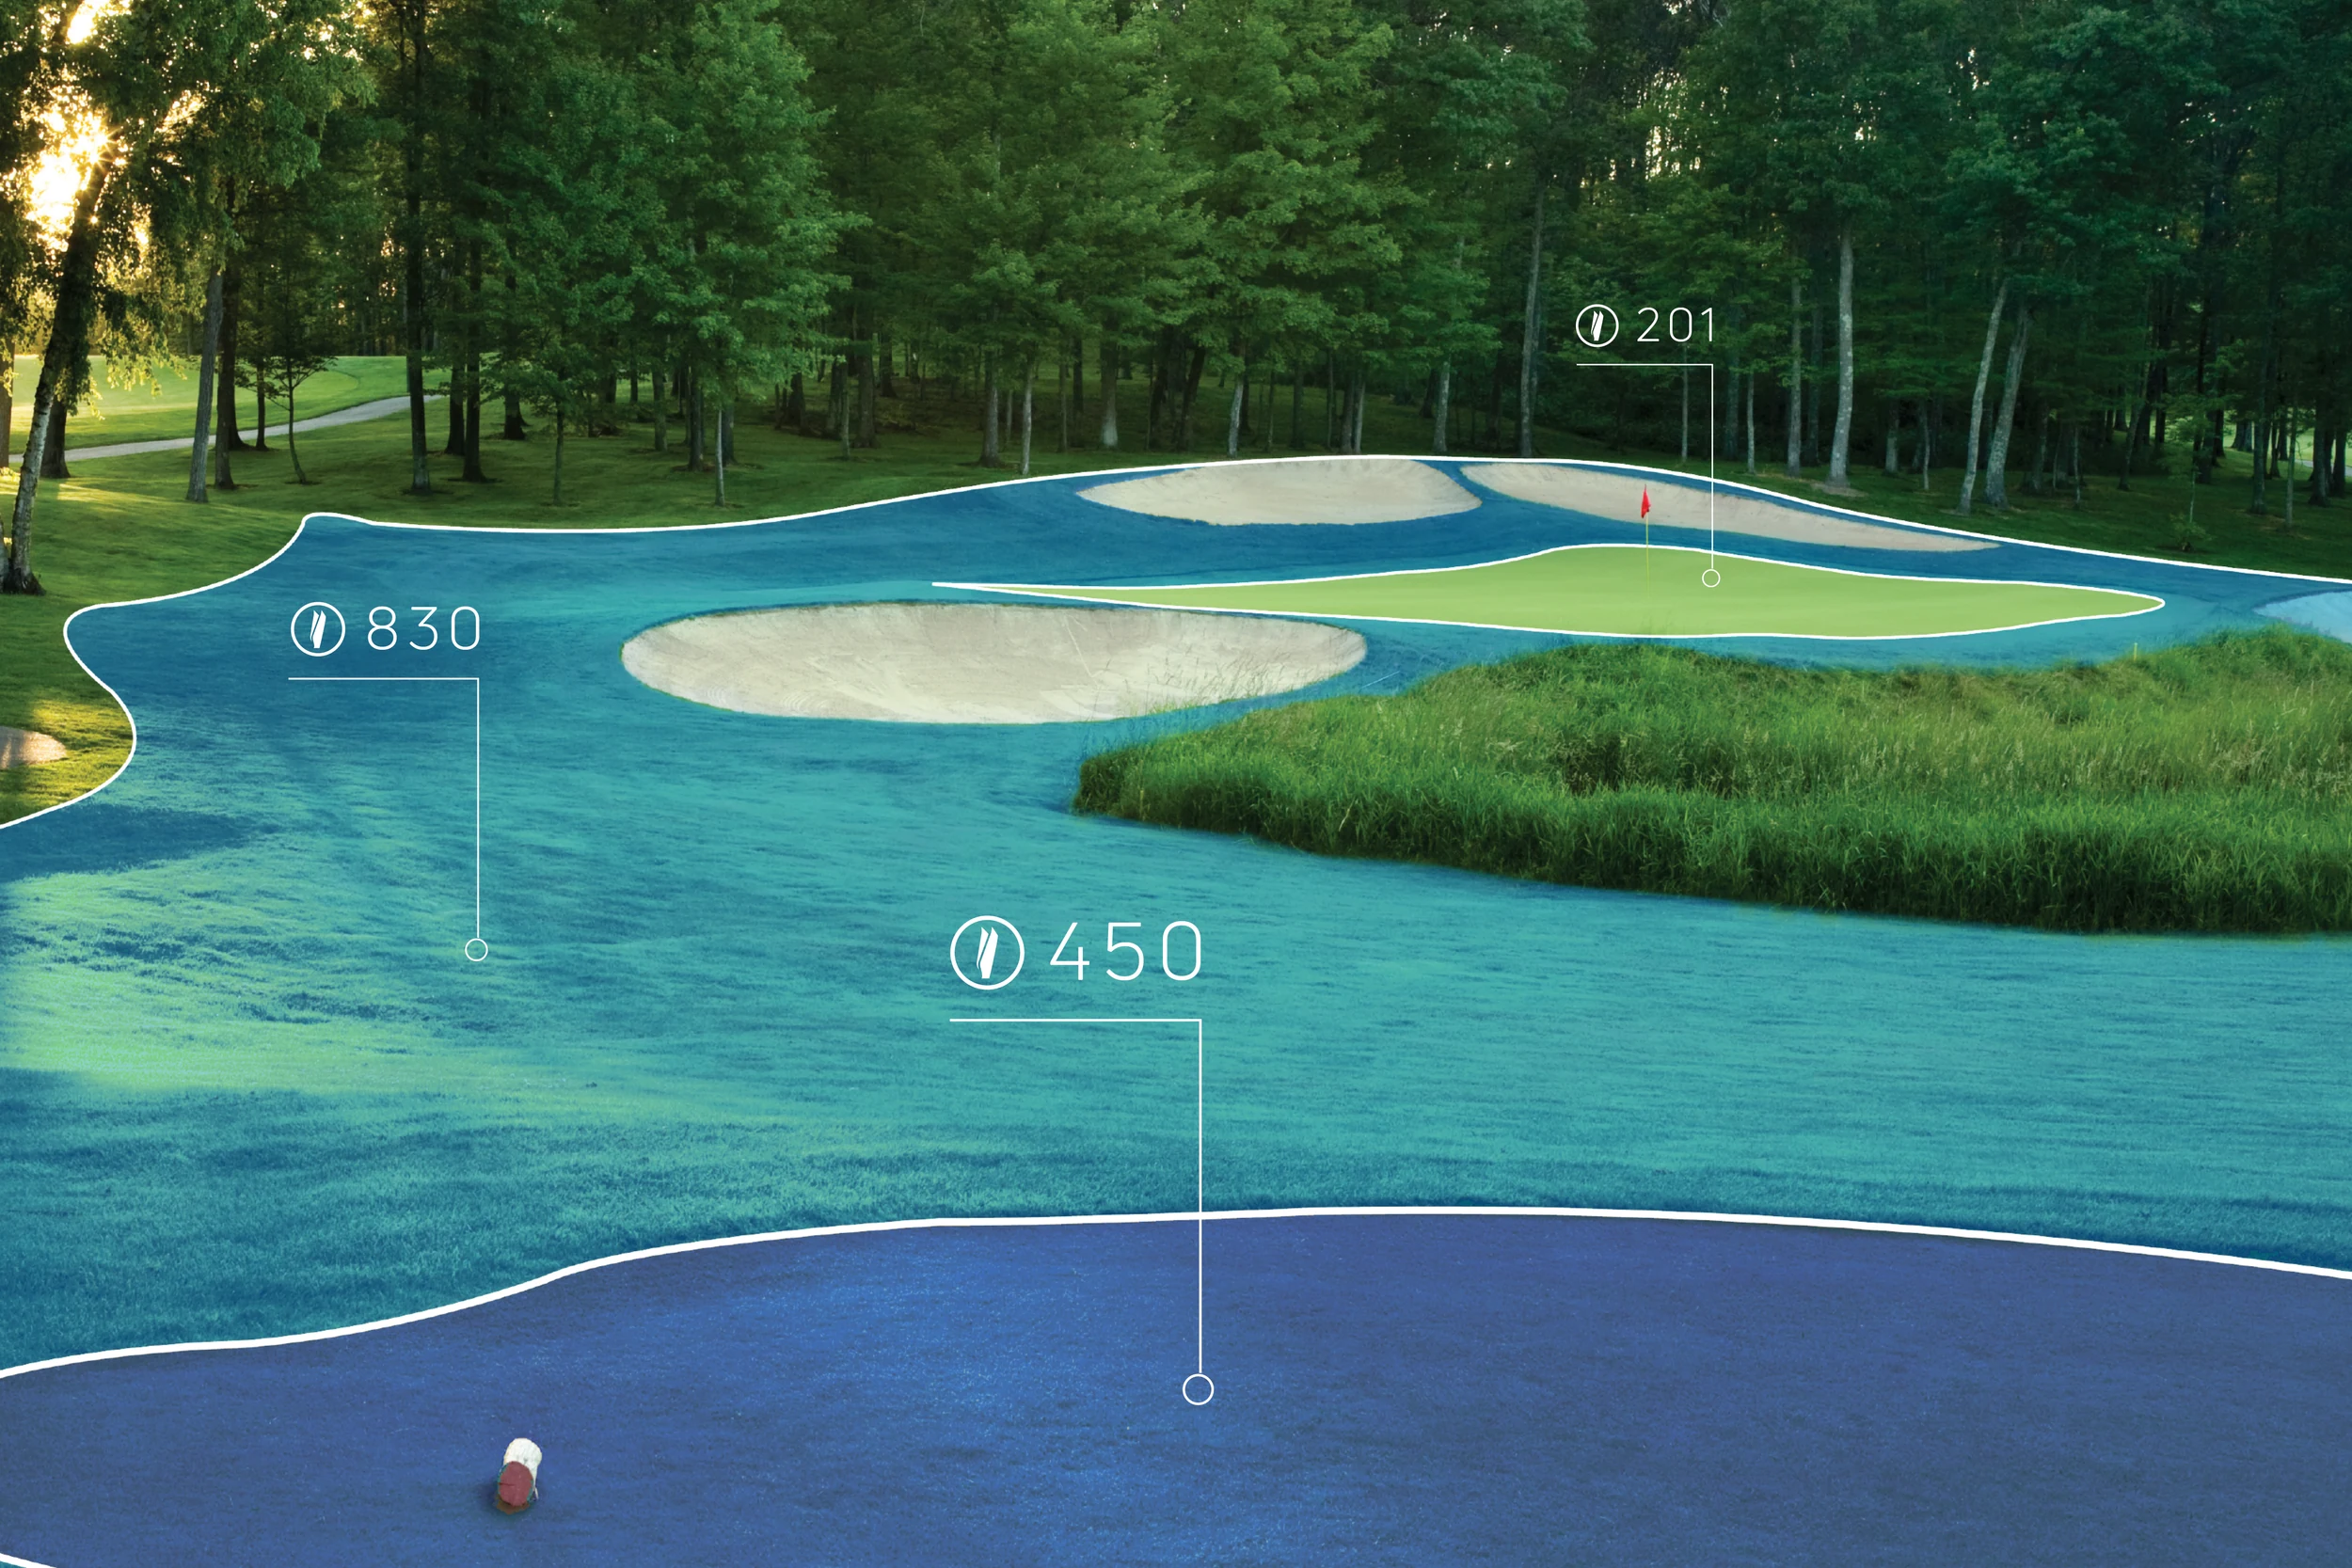
A health rating for your entire course.
Every hole breaks down by surface type, greens, fairways, tees, rough. Identify stressed areas quickly and track progress after interventions.
Greens
Highest resolution health monitoring.
Fairways
Coverage and wear patterns, hole by hole.
Tee Boxes
Rotation recommendations based on condition.
Rough
Consistency monitoring and trends.
Digital Twin
One evolving model of the course: shape, terrain and history together. Every flight adds a layer, building a living digital record your team can query season after season.
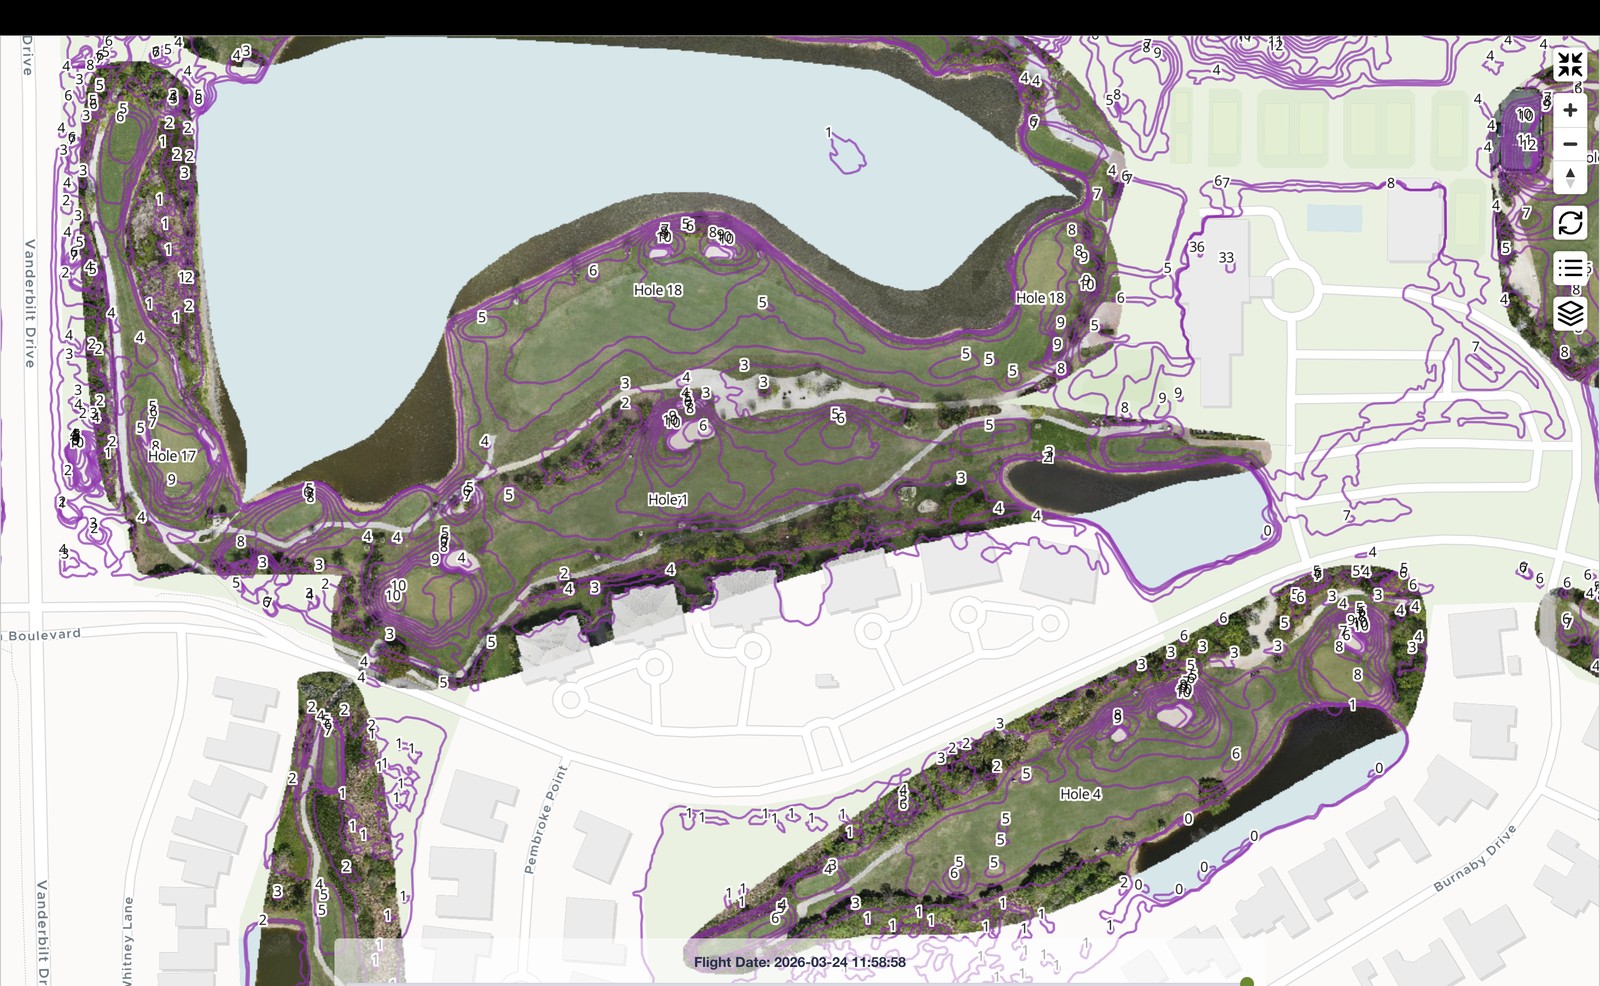
LiDAR and photogrammetry, hundreds of readings per metre.
In one flight, Turflogic captures elevation, water pooling areas, and pinch points where compaction concentrates, queryable alongside every stress map and irrigation overlay.
Your course's history, always accessible.
Every flight, NDVI data, TurfScore ratings, stress maps, is stored, indexed, and retrievable. A new superintendent walks in and sees exactly how the course performed under any condition.
Stress Maps
Four colour bands show what's failing before it's visible. Updated after each drone flight, reveals turf condition weeks before it's visible to the naked eye.
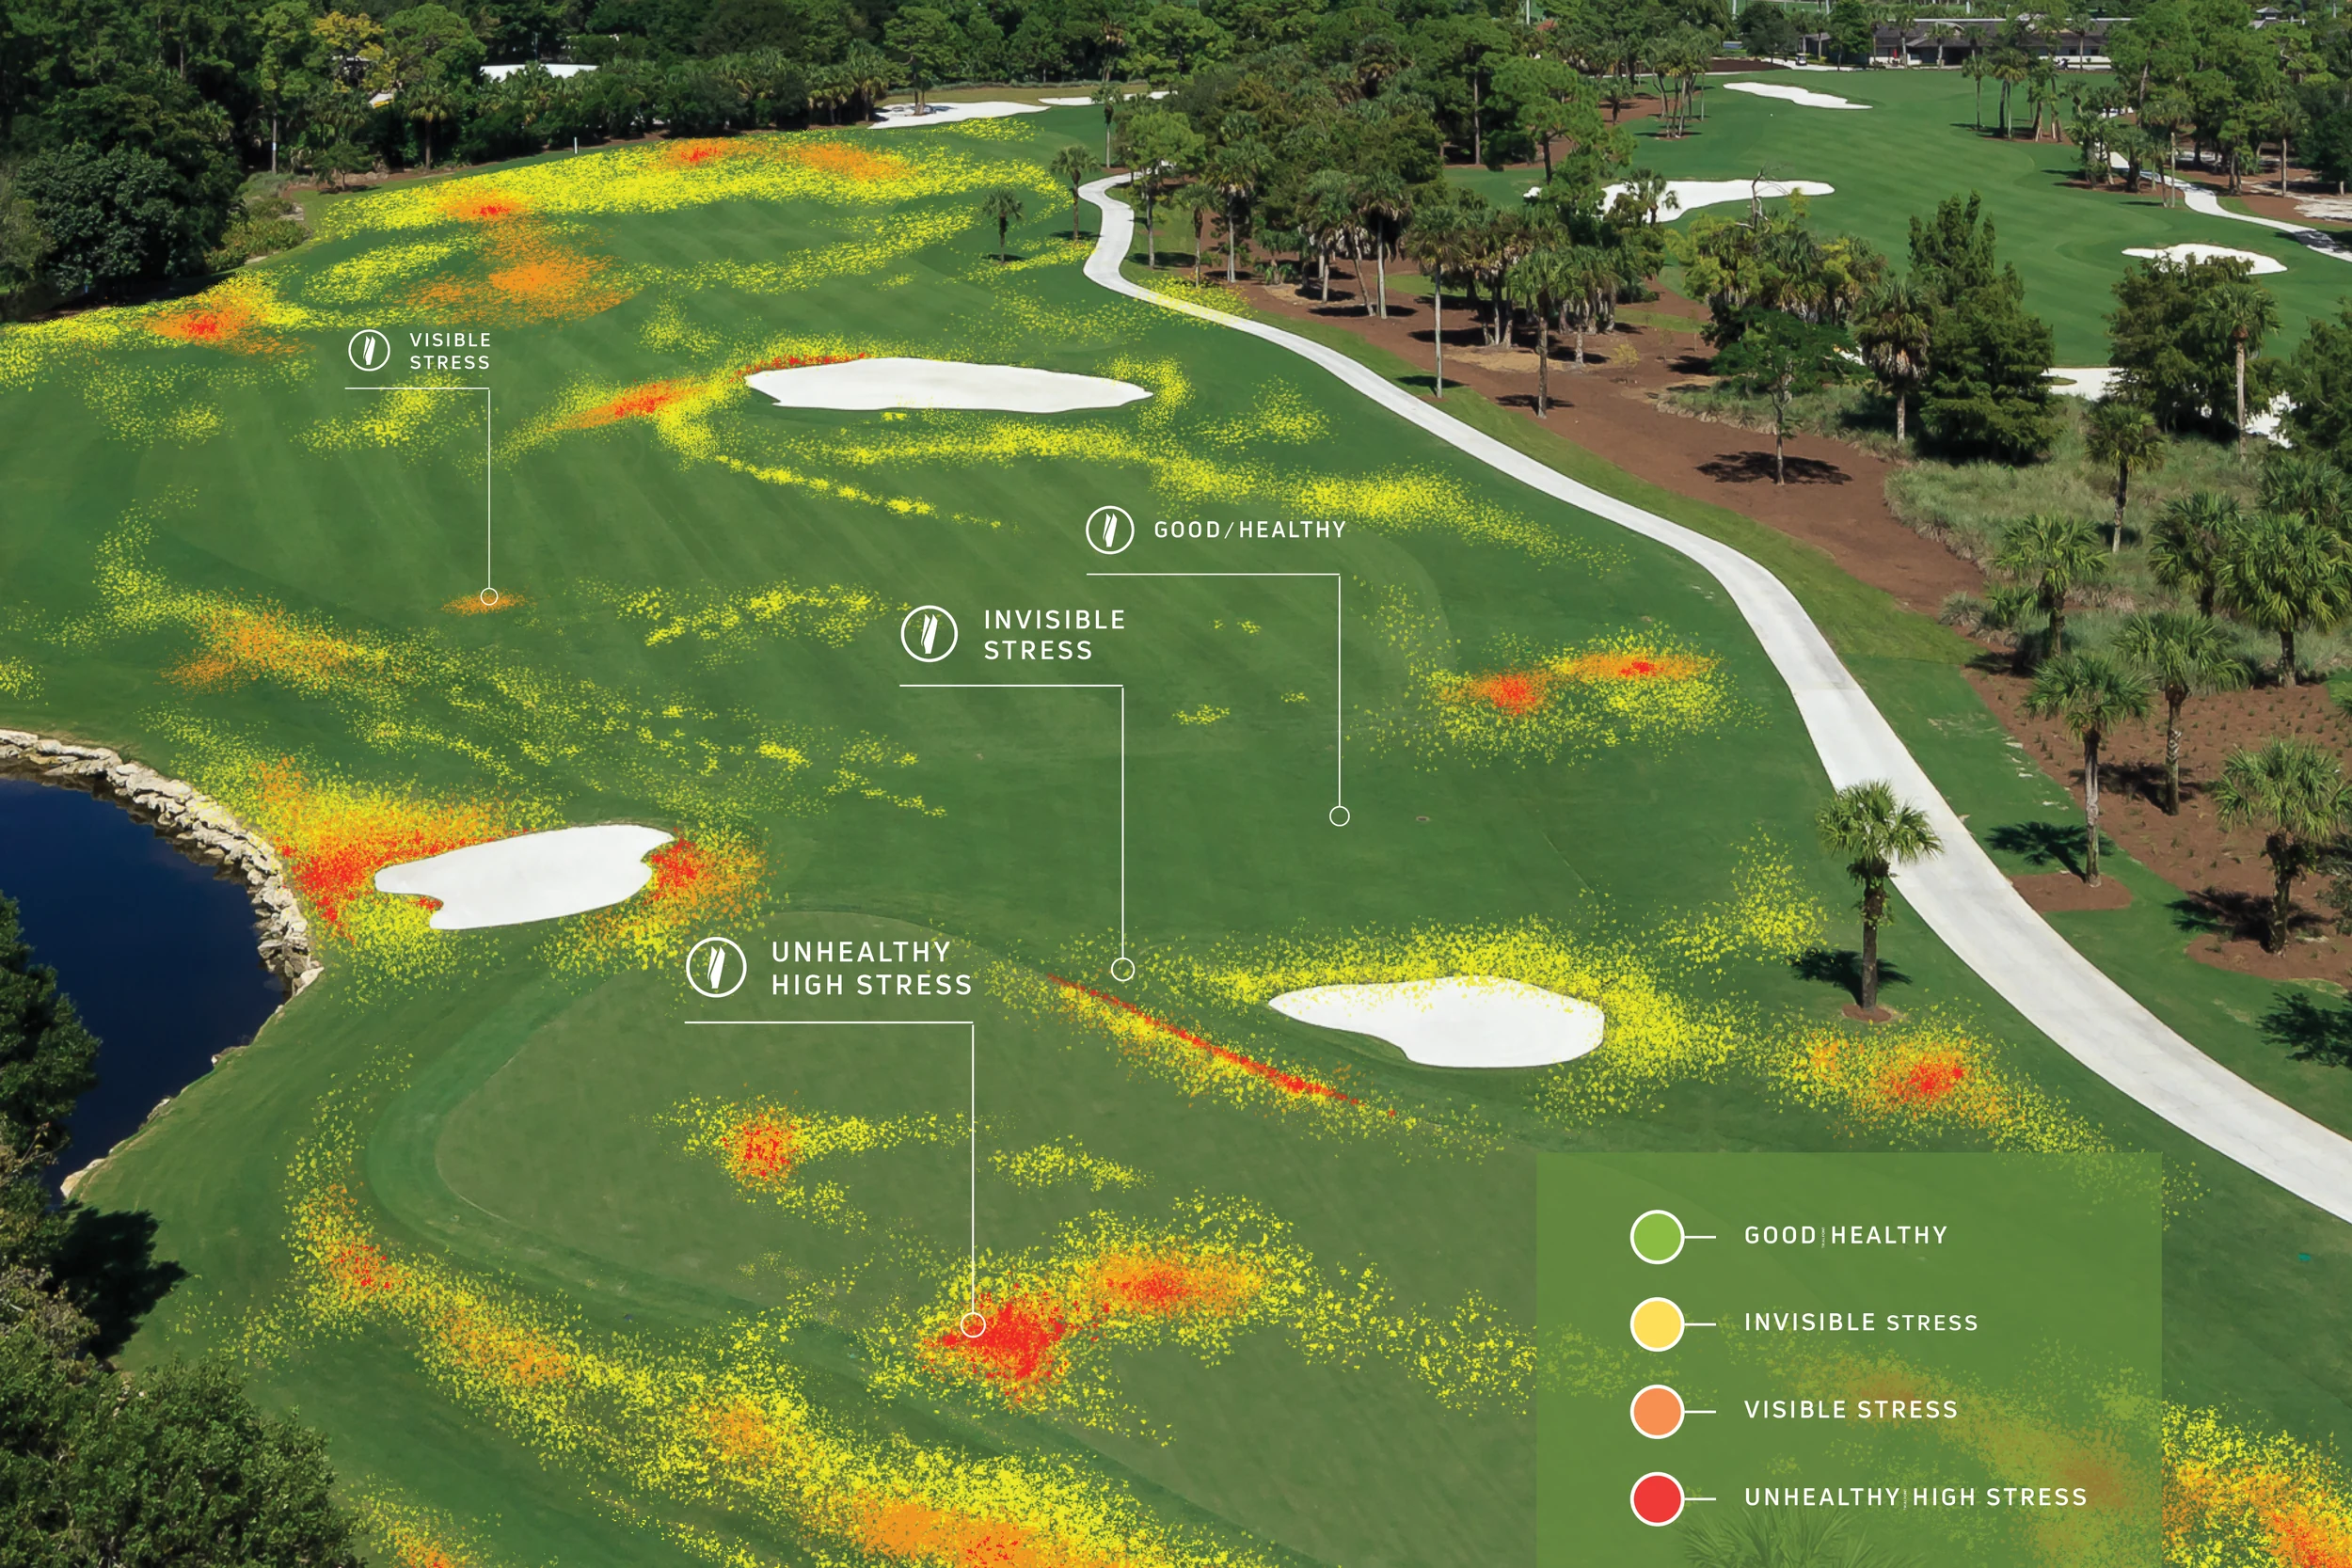
From clean aerial to complete intelligence.
Base watering, mowing, and maintenance decisions on real-time data rather than guesswork, across greens, fairways, tees, and rough.
Healthy
Normal, thriving turf.
Invisible Stress
Early stress detected before it shows visually.
Visible Stress
Stress conditions beginning to show.
Extreme Stress
Dead, not growing, or dormant turf.
Irrigation Mapping
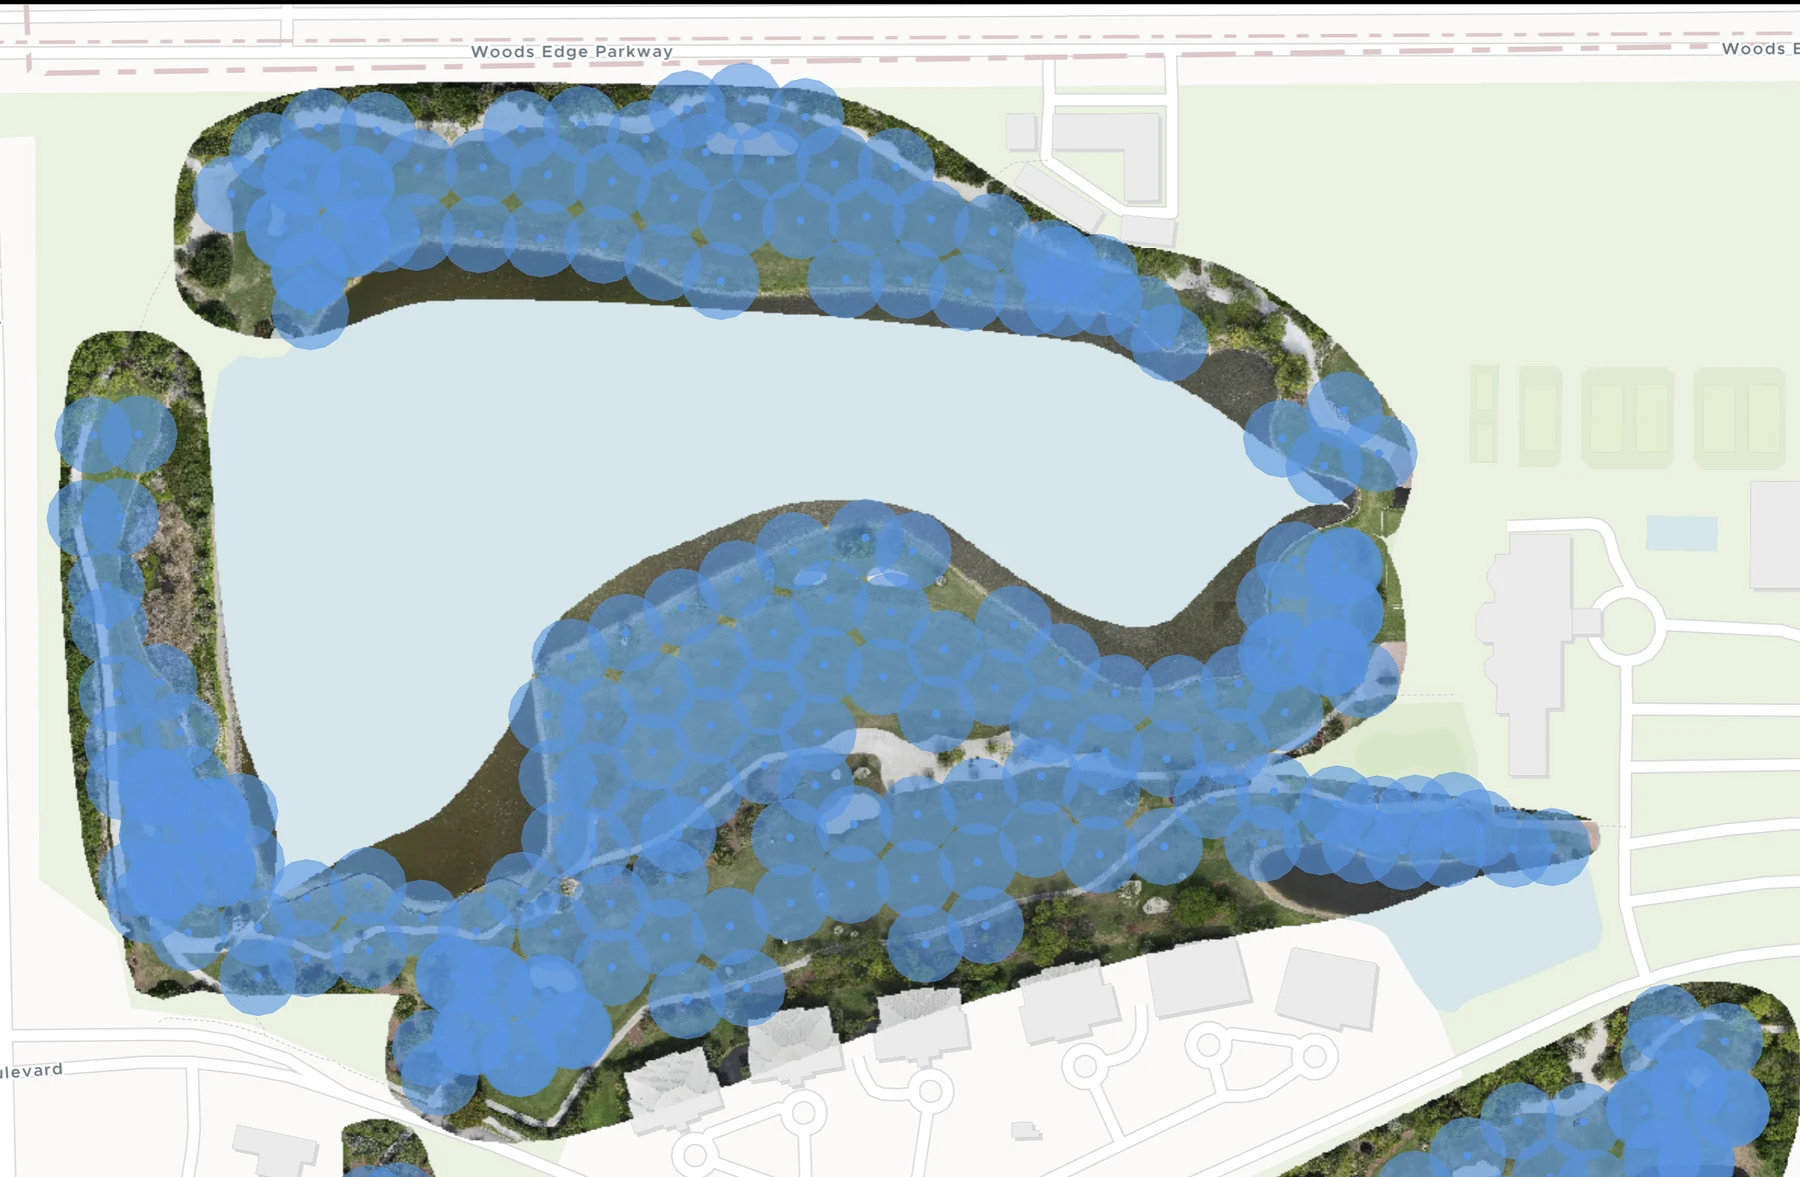
Every head, every zone, mapped as a living document. A complete GIS-accurate map of your irrigation system, overlaid with stress data so you know exactly where coverage meets consequence.
Mapped at a glance, coverage gaps exposed.
Every sprinkler head is geo-located on a live GIS map. Coverage radiuses show exactly where water reaches, and where it doesn't.
Remote Monitoring
The course, visible from anywhere, always on. Cloud-based access for as many users as you want to add, so the field, the office, and the boardroom see the same data.

Every reading, on any screen.
A live, interactive interface showing every zone's status, trend, and history. The superintendent in the field sees the same information as the GM in the boardroom.
Construction Management
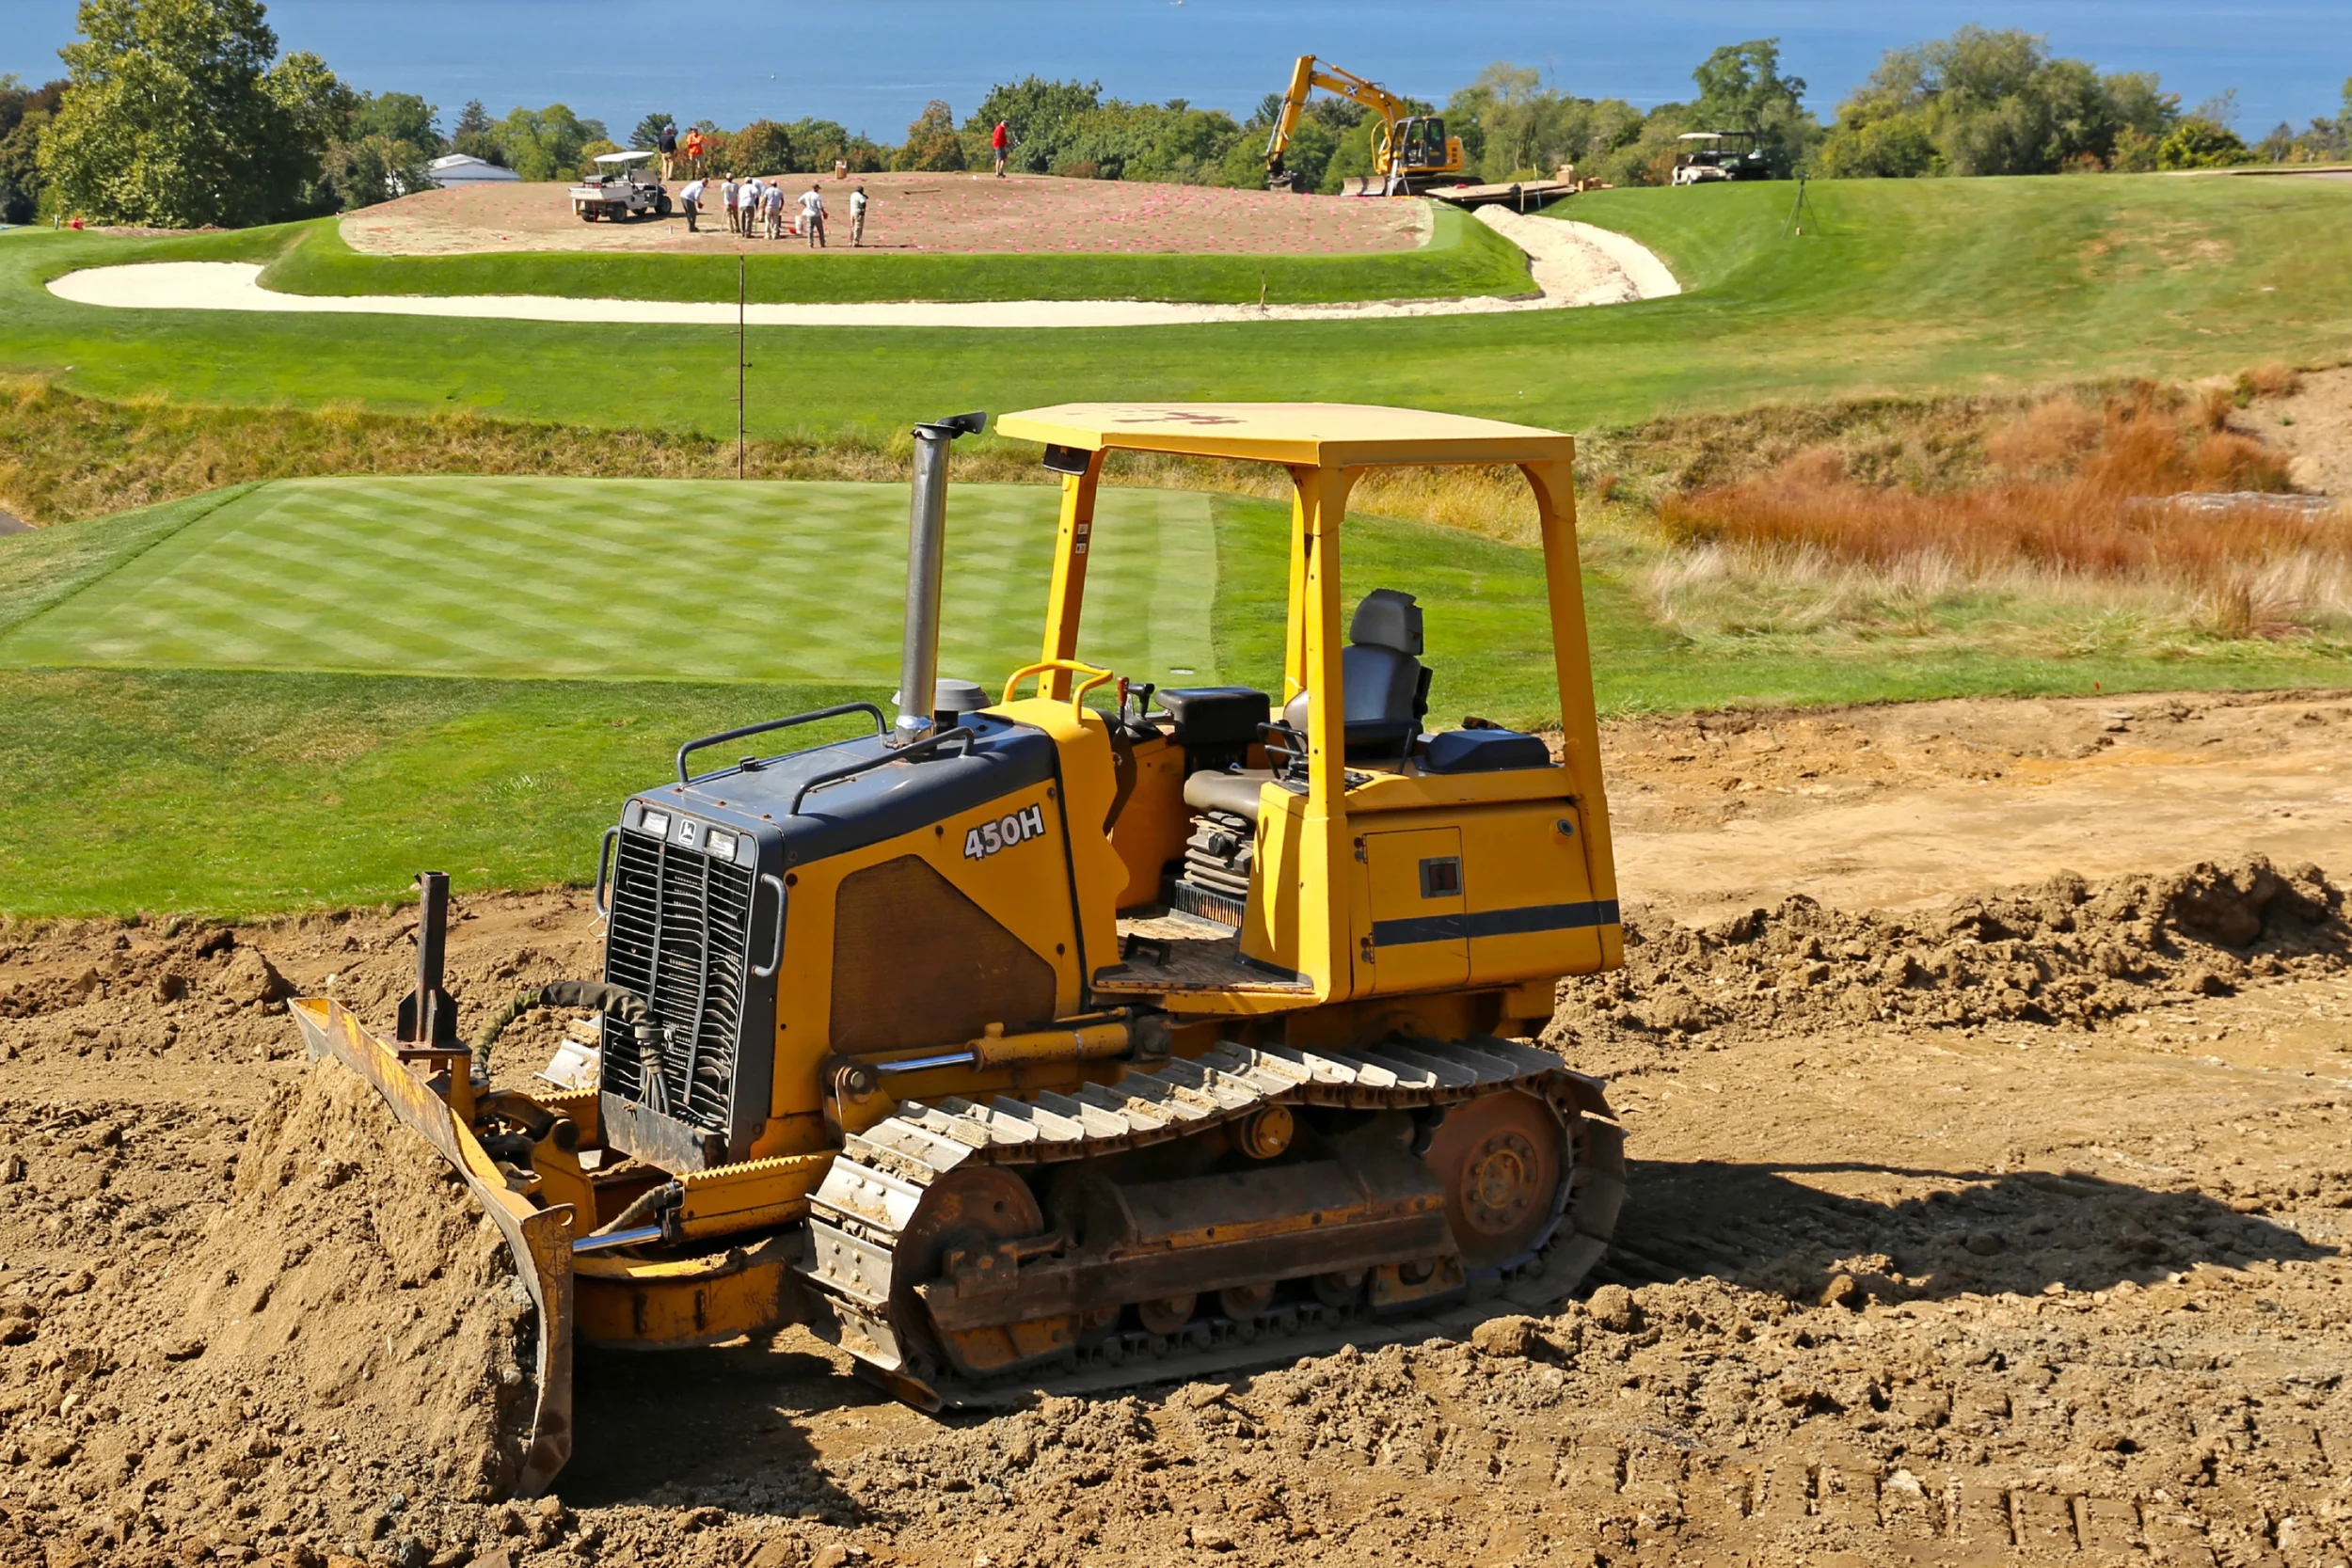
Grow-in and renovation, tracked from seed to opening day. The same objective intelligence that manages mature turf, applied to the moments that matter most.
Your flights already capture this.
No additional flights, no extra cost. Contractors, architects, boards, and ownership see the same real-time intelligence, eliminating disputes about progress.
The drone sees the surface.
Metos sees the subsurface.
Subsurface data, layered onto the surface picture. Non-contact electromagnetic sensors read 20 inches deep: moisture, conductivity, salinity, compaction, mounted on your existing maintenance vehicle.