Metos Beta is now open for qualifying courses Learn about Metos Apply for access
Courses & Success

Real courses.
Real data.

Every club in the Turflogic network is a live proof of concept, stress found early, interventions targeted, turf health trending upward.

View all courses & success stories
Learn
Platform
Courses & Success
Blog
Open TurfScore ↗ Talk to Us
Aerial view of a golf course used across the Turflogic platform
The Platform

One picture.
Complete clarity.

Every instrument Turflogic uses feeds a single outcome: an objective, continuously updated picture of your course's health, benchmarked, archived, and actionable.

Aerial view of a golf hole with Turflogic zone overlays and TurfScore ratings
Platform Overview

Hardware that captures.
Software that explains.

An 18-inch autonomous drone captures multispectral imagery on a set schedule while a METOS TSM scanner reads the soil beneath it during normal maintenance routes. The software turns both captures into one picture: a TurfScore for every zone, a stress map of what's failing, and a Digital Twin that carries the course's shape, terrain, and history in one place.

TurfScore

A three-digit score for every zone on the course. Simple, scientific, numeric, a weighted composite benchmarked against your own historical baseline, updated with every drone flight.
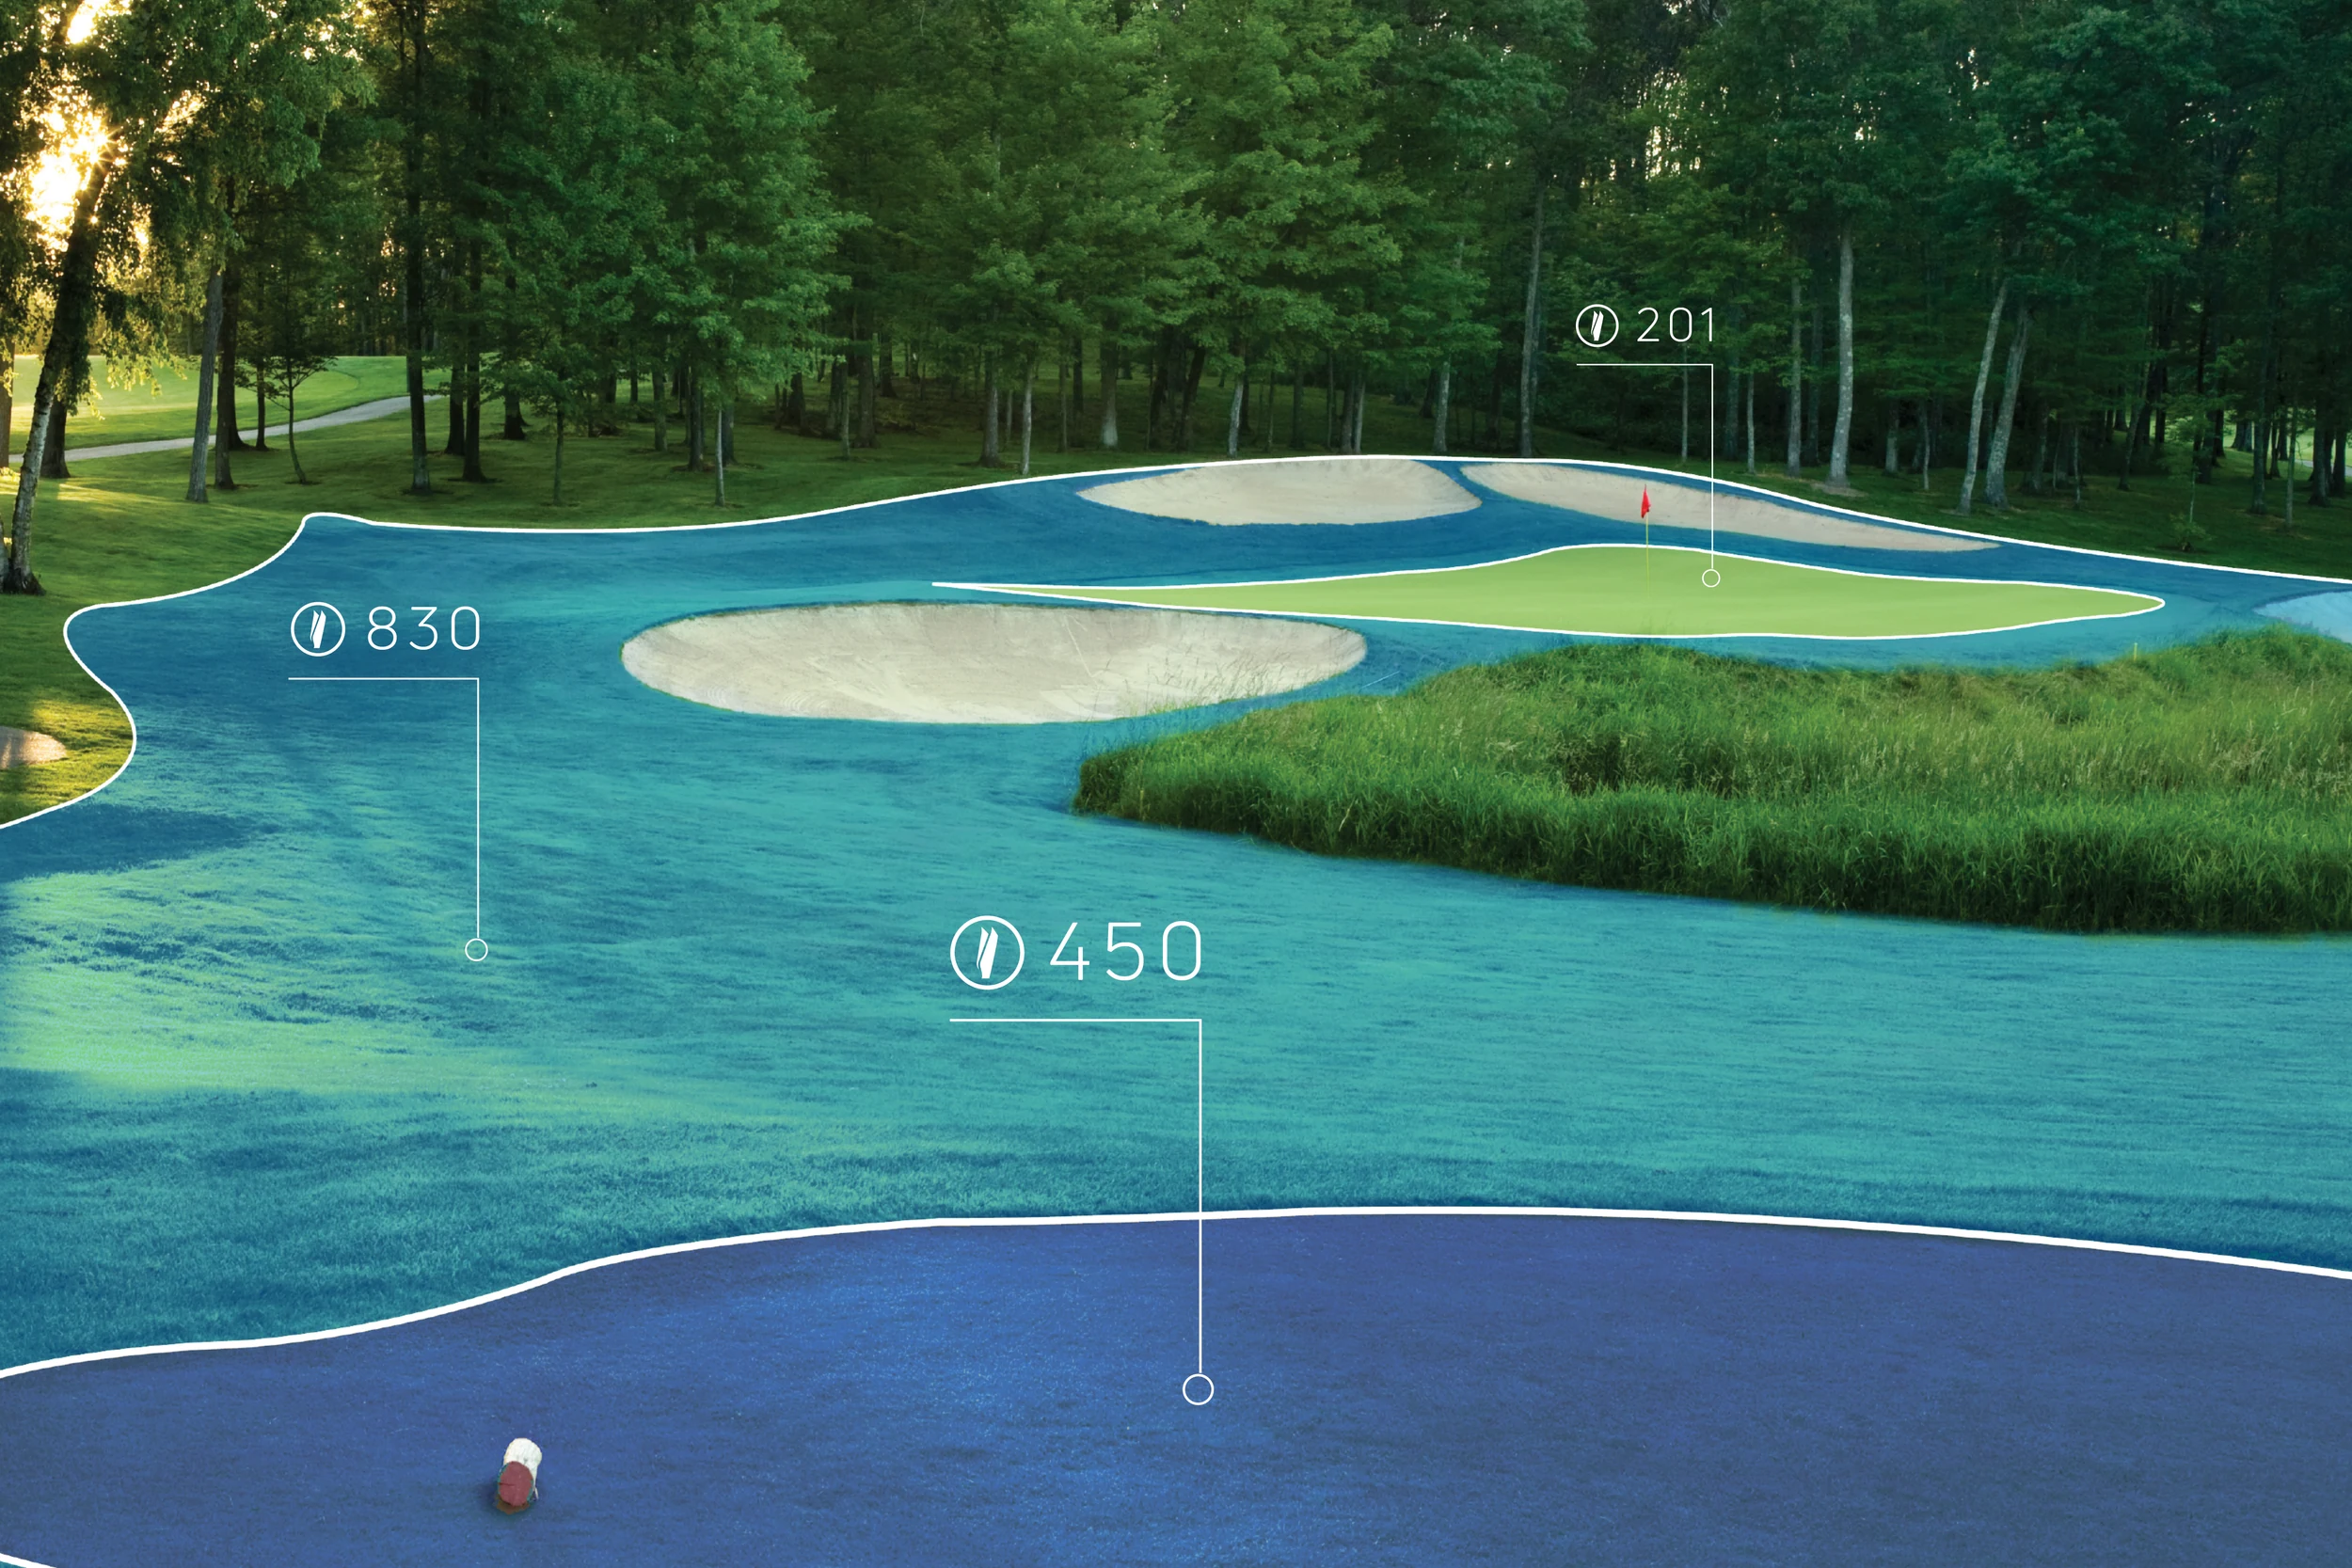
A health rating for your entire course.

Every hole breaks down by surface type, greens, fairways, tees, rough. Identify stressed areas quickly and track progress after interventions.

TurfScore table with zone scores
TurfScore platform hole map showing zone-by-zone health data

Greens

Highest resolution health monitoring.

Fairways

Coverage and wear patterns, hole by hole.

Tee Boxes

Rotation recommendations based on condition.

Rough

Consistency monitoring and trends.

Digital Twin

One evolving model of the course: shape, terrain and history together. Every flight adds a layer, building a living digital record your team can query season after season.
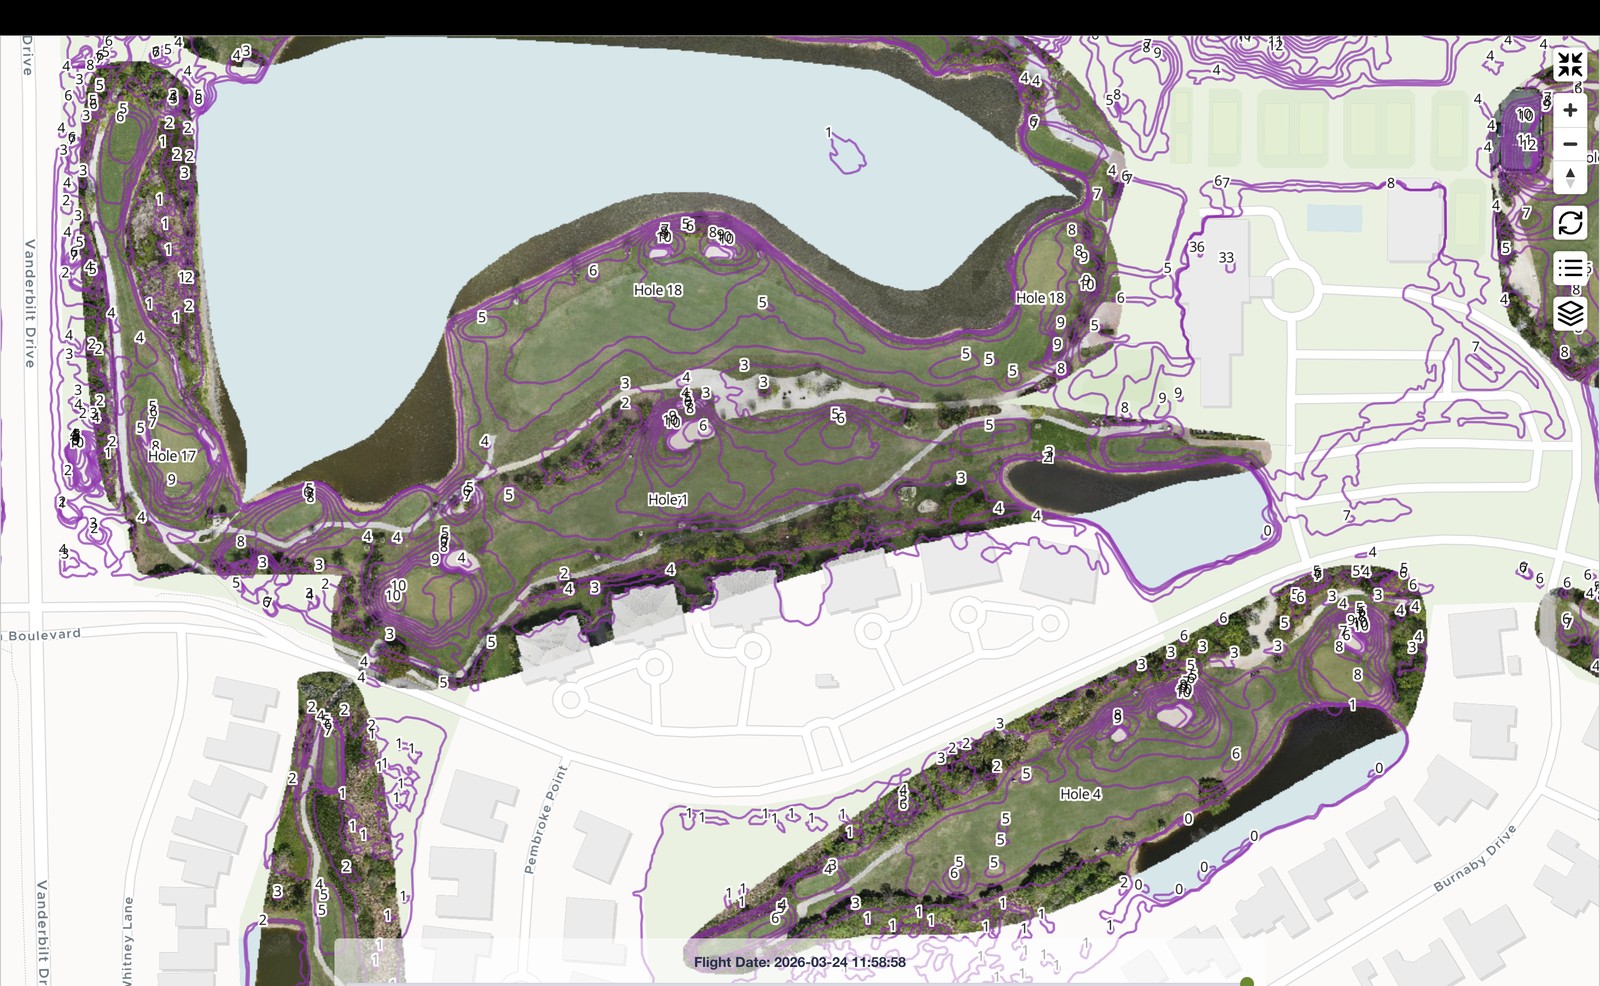
LiDAR and photogrammetry, hundreds of readings per metre.

In one flight, Turflogic captures elevation, water pooling areas, and pinch points where compaction concentrates, queryable alongside every stress map and irrigation overlay.

Contour map showing terrain elevation across a golf course
TurfStory timeline of archived flights

Your course's history, always accessible.

Every flight, NDVI data, TurfScore ratings, stress maps, is stored, indexed, and retrievable. A new superintendent walks in and sees exactly how the course performed under any condition.

Stress Maps

Four colour bands show what's failing before it's visible. Updated after each drone flight, reveals turf condition weeks before it's visible to the naked eye.
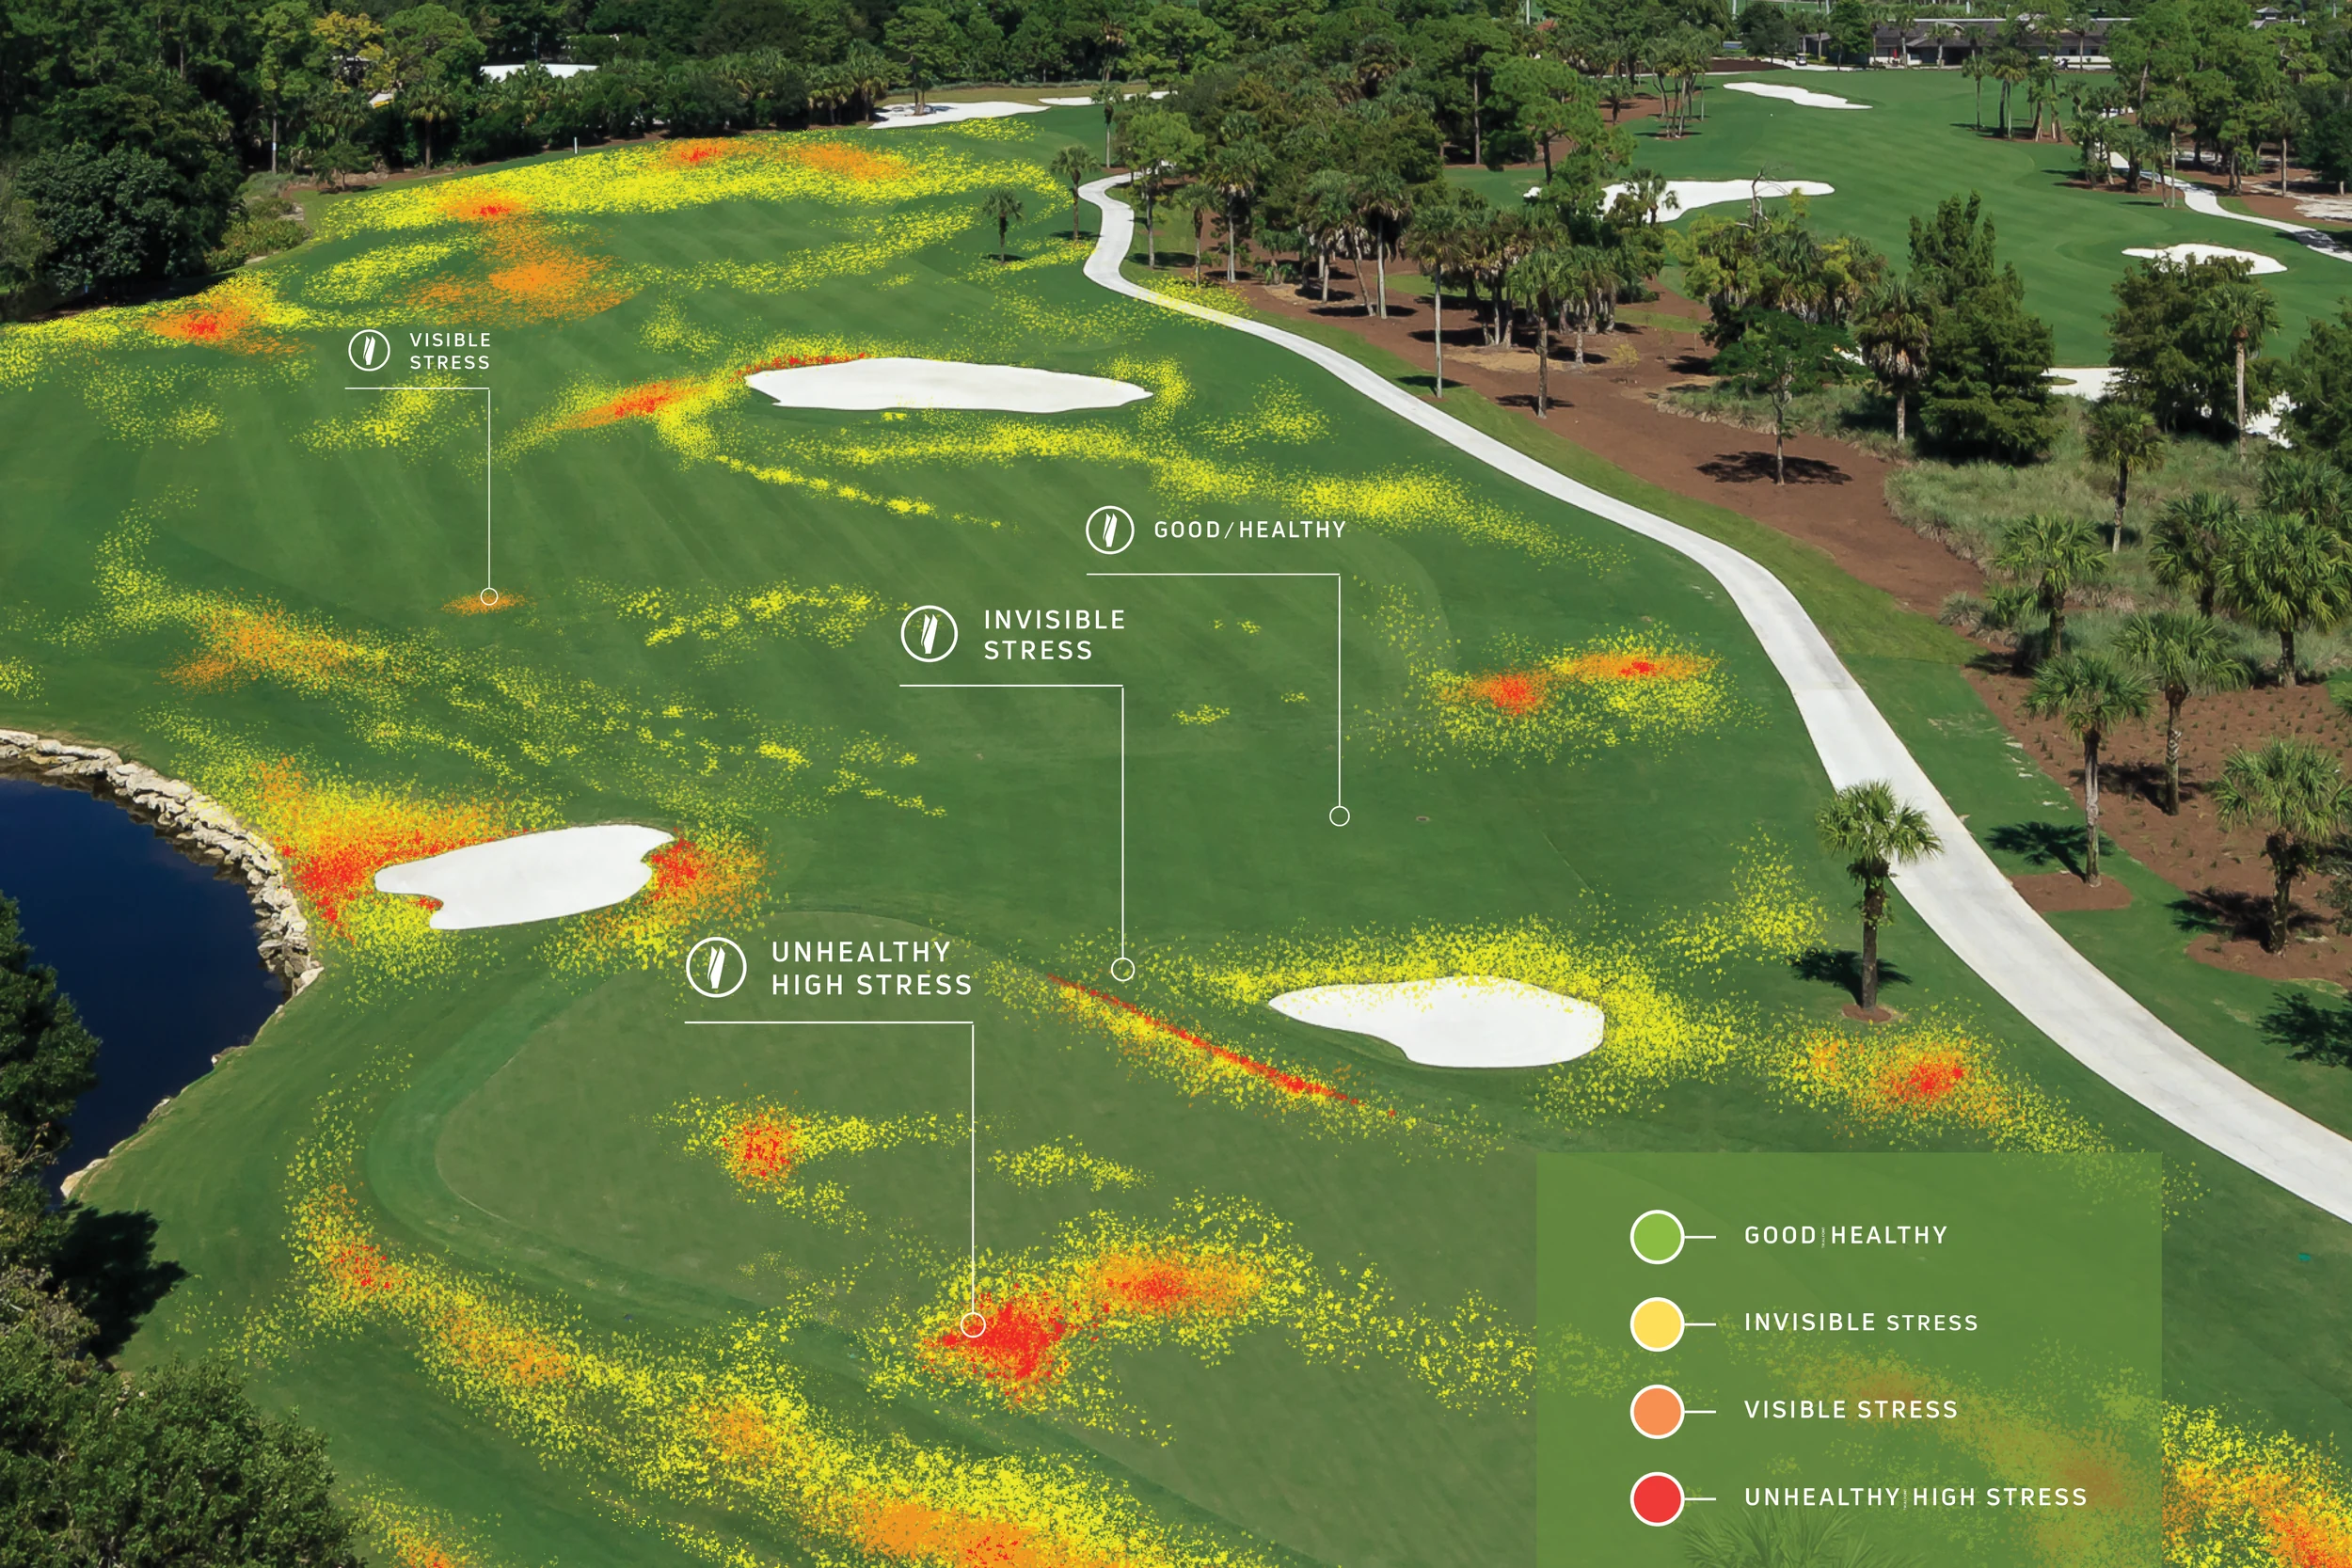
Healthy

Normal, thriving turf.

Invisible Stress

Early stress detected before it shows visually.

Visible Stress

Stress conditions beginning to show.

Extreme Stress

Dead, not growing, or dormant turf.

From clean aerial to complete intelligence.

Base watering, mowing, and maintenance decisions on real-time data rather than guesswork, across greens, fairways, tees, and rough.

Full-course stress map showing four distinct stress categories across fairways and greens
Stress map overlay showing invisible turf stress patterns

Irrigation Mapping

Every head, every zone, mapped as a living document. A complete GIS-accurate map of your irrigation system, overlaid with stress data so you know exactly where coverage meets consequence.

Mapped at a glance, coverage gaps exposed.

Every sprinkler head is geo-located on a live GIS map. Coverage radiuses show exactly where water reaches, and where it doesn't.
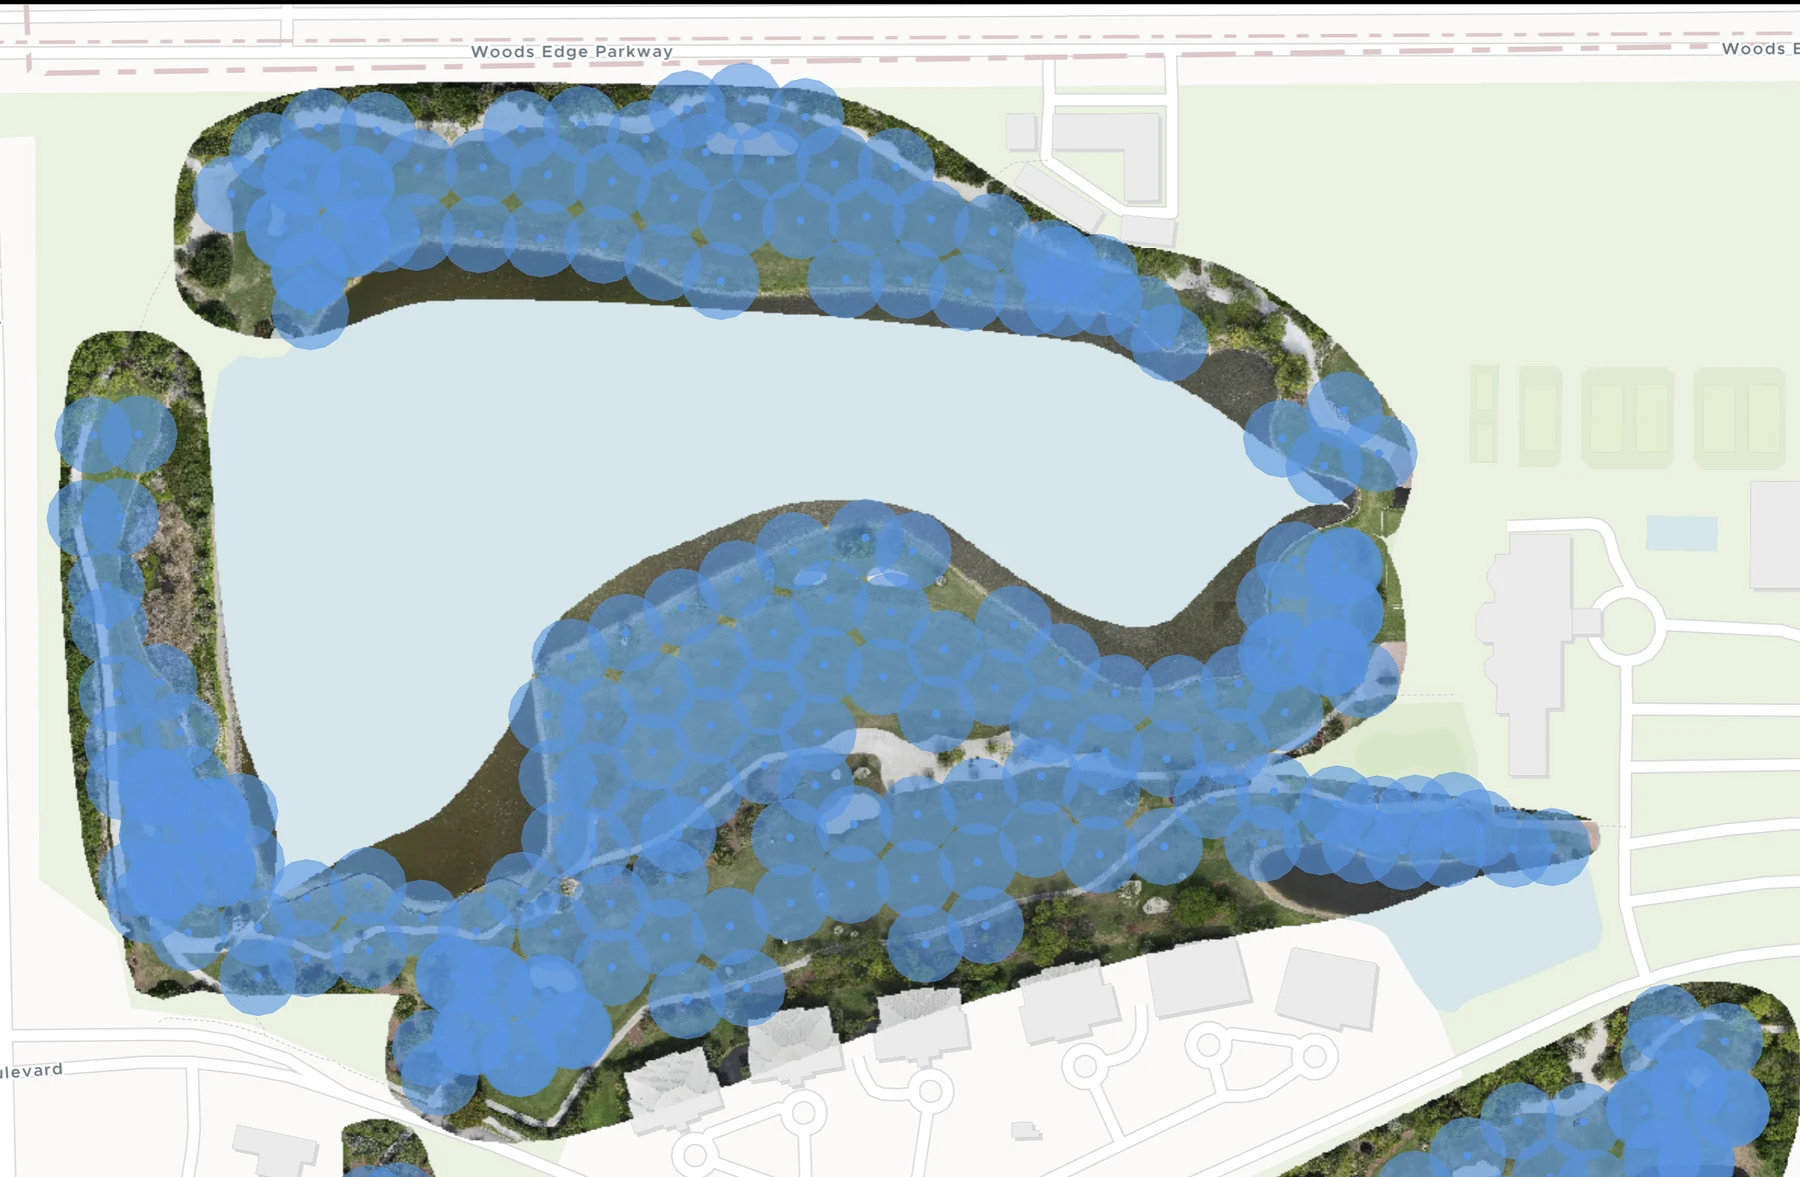
Irrigation head outlines mapped over a golf course fairway
Geo-located irrigation heads on course map

Remote Monitoring

The course, visible from anywhere, always on. Cloud-based access for as many users as you want to add, so the field, the office, and the boardroom see the same data.

Every reading, on any screen.

A live, interactive interface showing every zone's status, trend, and history. The superintendent in the field sees the same information as the GM in the boardroom.

TurfScore platform showing current course health data on any device
TurfScore scores table, platform view

Construction Management

Grow-in and renovation, tracked from seed to opening day. The same objective intelligence that manages mature turf, applied to the moments that matter most.

Your flights already capture this.

No additional flights, no extra cost. Contractors, architects, boards, and ownership see the same real-time intelligence, eliminating disputes about progress.

Construction and grow-in site tracked by drone flight
TurfScore platform showing construction zone timeline and NDVI progression

The drone sees the surface.
Metos sees the subsurface.

Subsurface data, layered onto the surface picture. Non-contact electromagnetic sensors read 20 inches deep: moisture, conductivity, salinity, compaction, mounted on your existing maintenance vehicle.


METOS TSM soil scanner unit METOS TSM mounted on utility vehicle on golf course
Scan Depth
20 inches
Full root zone coverage.
Points / Acre
10,000
Granular detail across the zone.
Measurements
4, one pass
Moisture, conductivity, salinity, compaction.
Soil Disturbance
0
Non-contact, no probes, no plugs.
In development

From stress map to work order.

A stress map shows where turf is under pressure. Prescriptions turn that picture into a plan: which zones need attention first, ranked by severity, so your team knows where to go before they walk the course.

In development

Chemical guidance, grounded in your data.

Recommendations tied to what a zone's stress map and Metos readings actually show, not a generic spray calendar. The same capture that finds the problem points toward what addresses it.

Benefits

What the data means for you.

Proof it worked sits above the rest: a follow-up flight over the same zone shows whether a treatment worked, stress reduced, recovery underway, or not yet. The proof sits in the flight archive next to the original problem, not in a spreadsheet somewhere else.

TurfScore
A number your team and your board both trust, updated every flight.
Digital Twin
See how the course has changed, not just how it looks today.
Stress Maps
Catch a problem weeks before it's visible on the ground.
Irrigation Mapping
Know what's in the ground before you dig or diagnose.
Remote Monitoring
Check the course without leaving the office.
Construction Management
A verifiable record for every grow-in, seed to opening day.
Metos
Know why a zone is stressed, not just where.
Prescriptions
Know where to send the crew first.
Products
Spend on product only where the data says it's needed.
Why it's a platform, not a toolkit

The pieces explain each other.

A stress map shows what's happening. The Digital Twin shows what the ground makes possible. Metos shows why a zone is stressed, not just where. TurfScore turns all of it into one number your team and your board both trust. Each piece works alone; together, they turn observation into an evidenced decision.

Request a
conversation.

We'll show you exactly what the platform looks like on your course.

Request a Conversation
Turflogic AI Online
Hi there! I'm the Turflogic assistant. Ask me anything about our platform, drone technology, soil scanning, or turf management.