The Science
of Stress.
Turf stress begins where you can't see it. Understanding how stress develops, and how multispectral imaging finds it, is the foundation of everything Turflogic does.
Golf course management has relied on observation for decades. Turflogic adds objective, continuous intelligence, finding problems before they surface.
Our approachEvery instrument Turflogic uses feeds a single outcome: an objective, continuously updated picture of your course’s health, benchmarked, archived, and actionable.
Open TurfScoreEvery club in the Turflogic network is a live proof of concept, stress found early, interventions targeted, turf health trending upward.
Turf stress begins where you can't see it. Understanding how stress develops, and how multispectral imaging finds it, is the foundation of everything Turflogic does.
Turf decline begins at the cellular level—weeks before it shows. By the time visible symptoms appear, you've already missed the low-cost intervention window.
Turflogic detects early condition changes using NDVI analysis and multispectral imaging, enabling precision timing for maintenance decisions.
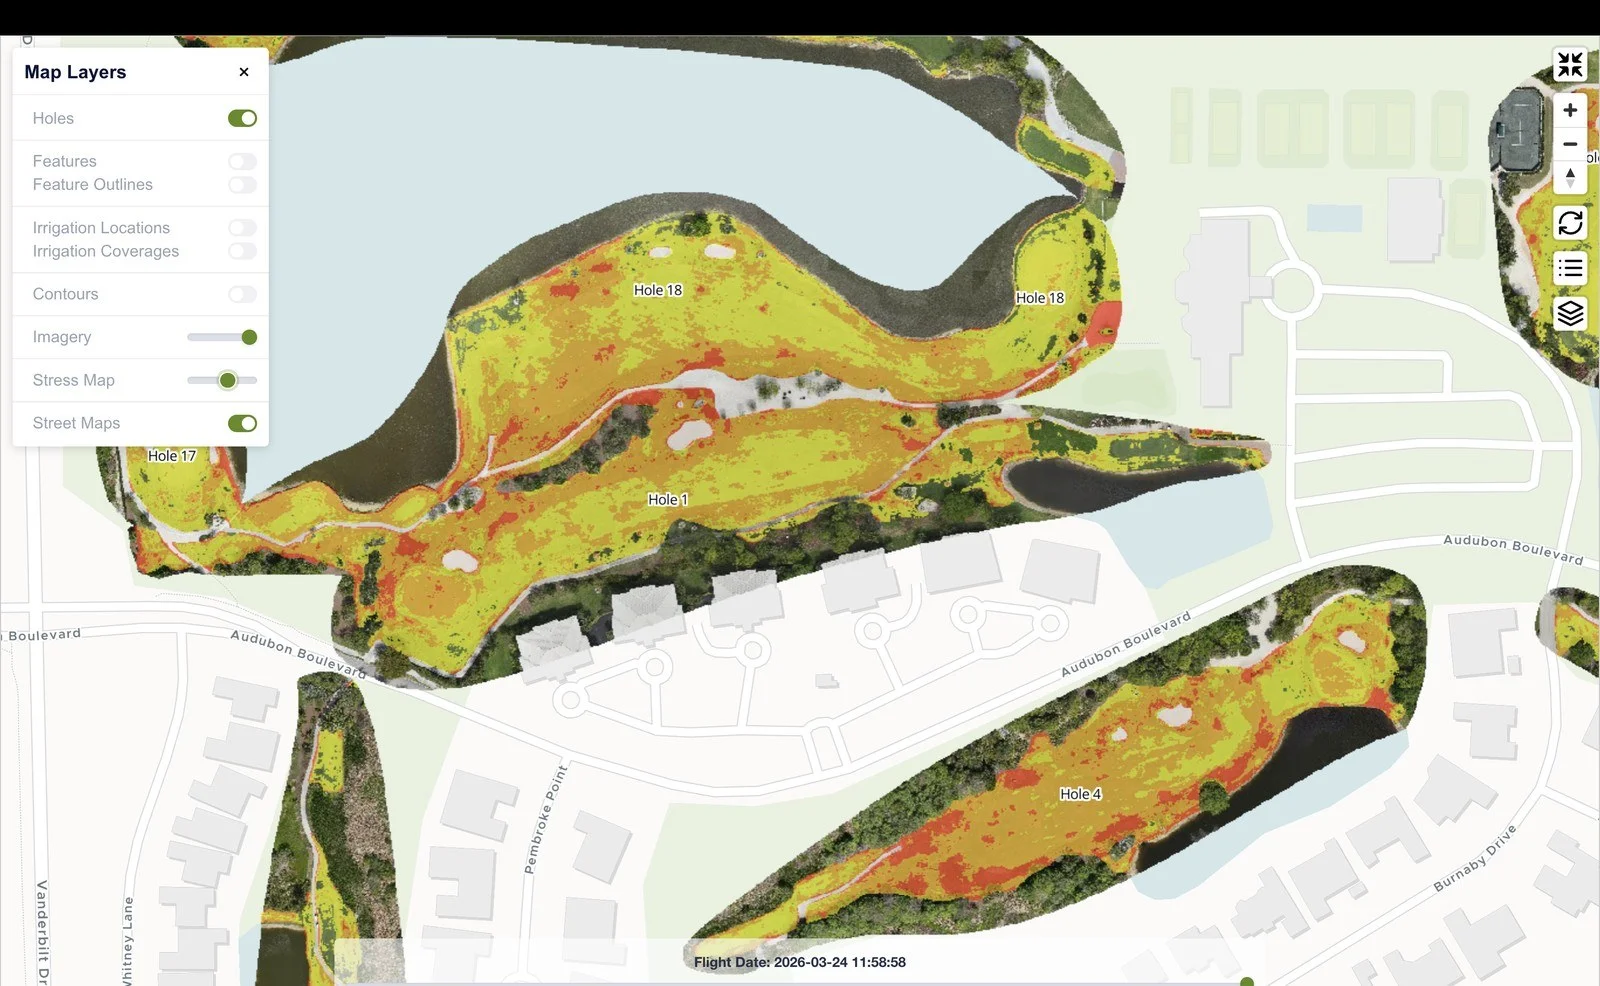
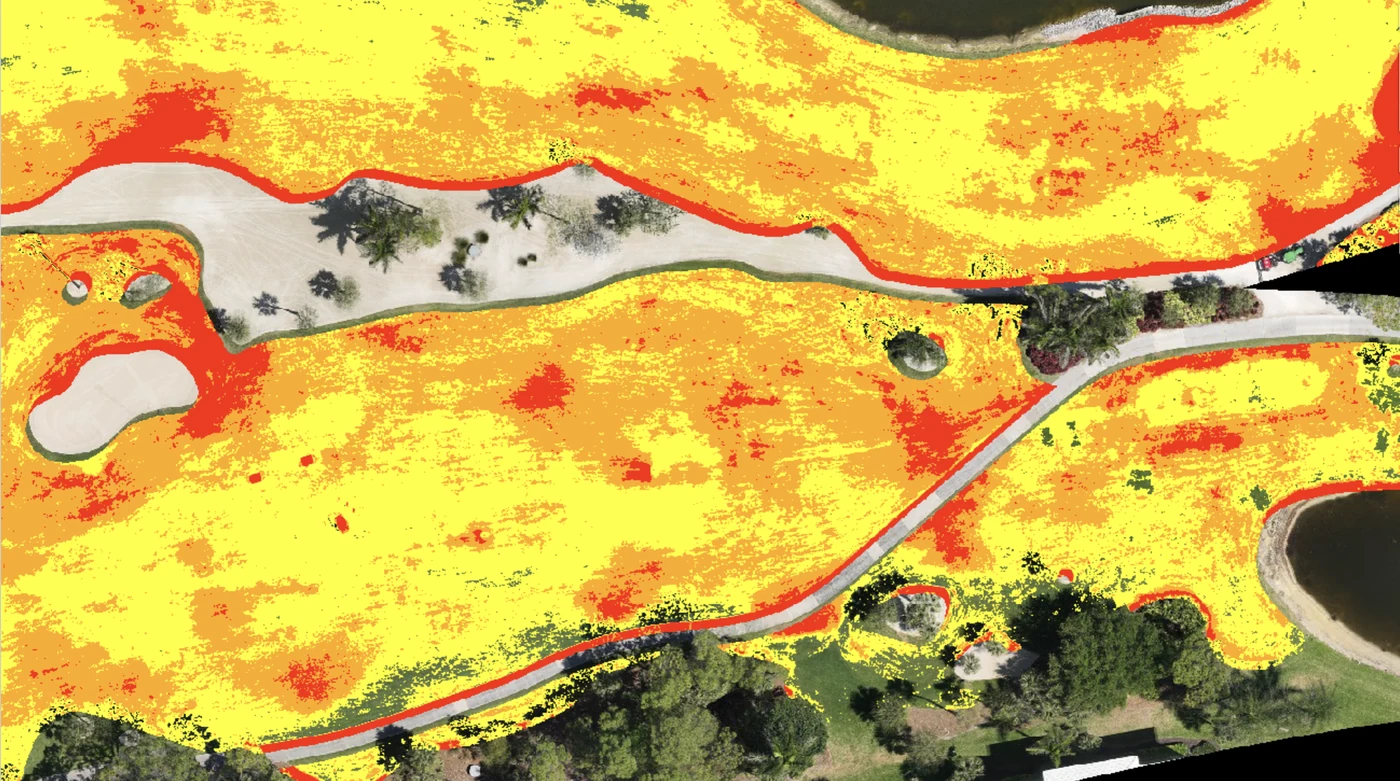
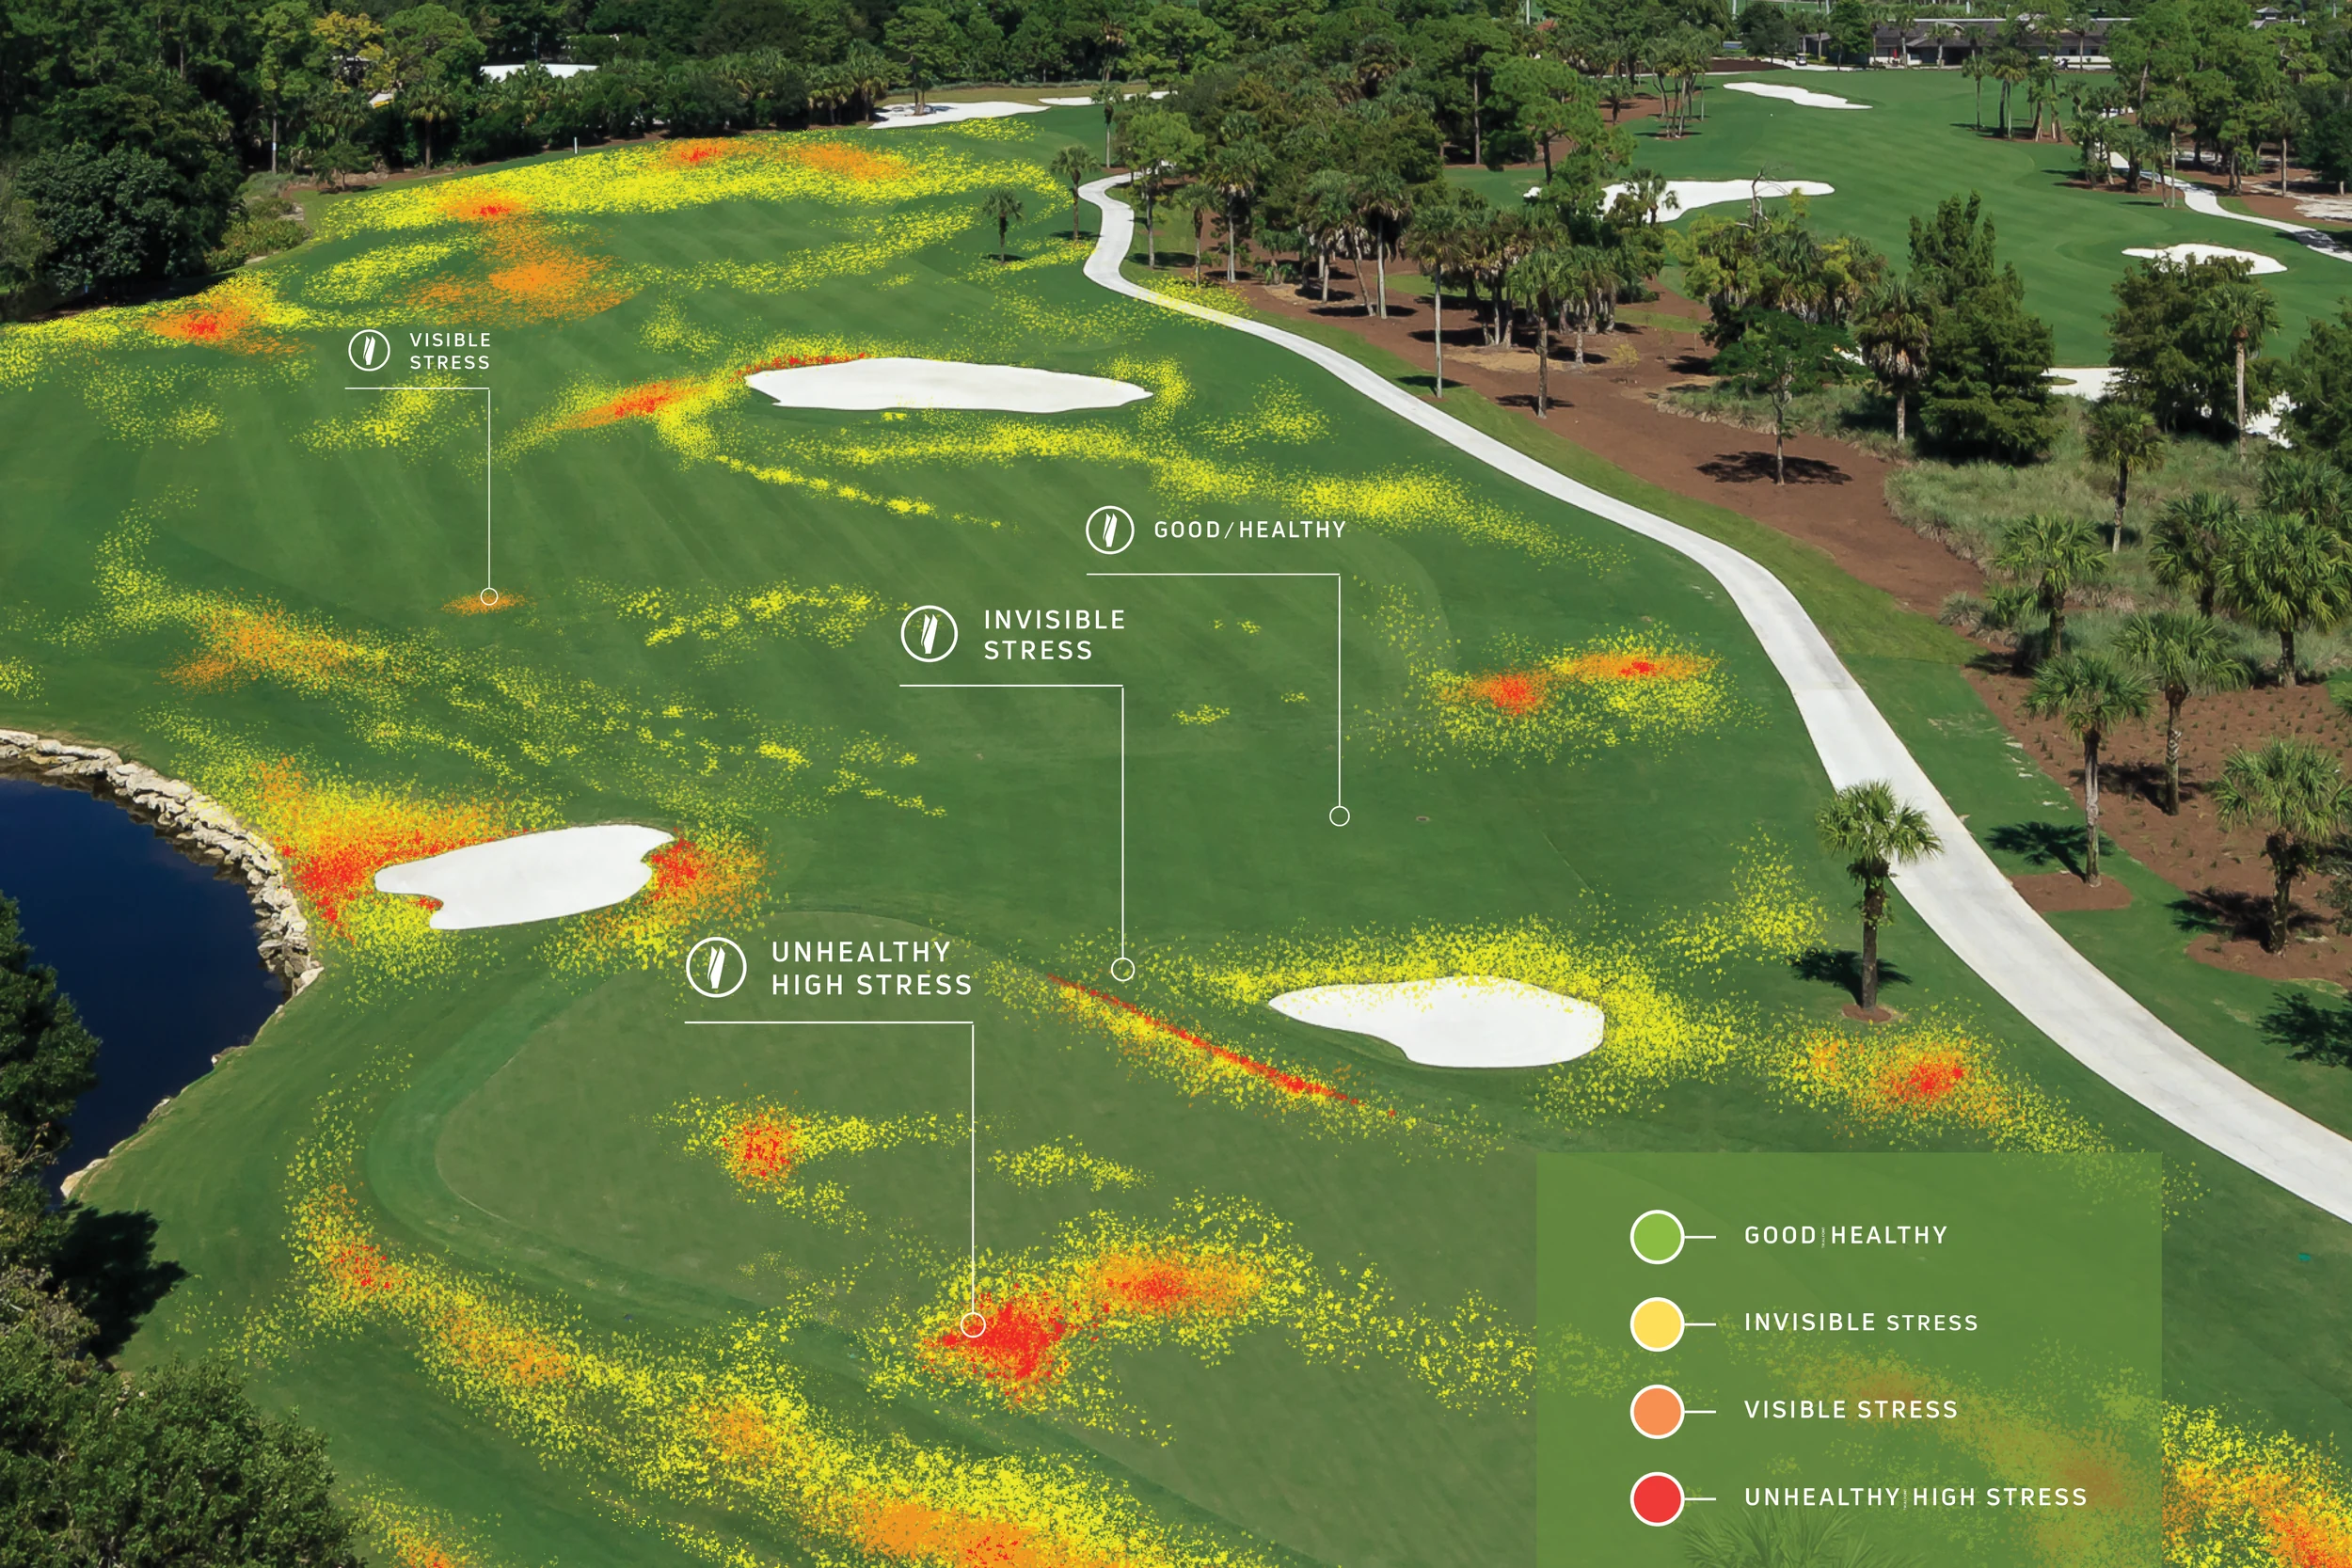
Every flight classifies turf into four condition categories—Good, Invisible, Visible, and Unhealthy stress—color-coded on your stress map for quick identification.
Drone flight collects multispectral data across every zone.
Radiometric correction ensures flight-to-flight comparability.
Each pixel assigned a stress category based on reflectance signature.
Finished map appears in TurfScore, searchable, zoomable, and archived.
Each flight adds to a searchable historical archive. Track condition patterns, compare across seasons, and base maintenance decisions on real data—not guesswork.
We'll show you exactly how the platform finds early stress, with live data from courses in the network.