Condition Maps.
Four health categories, updated after each drone flight. Reveal turf condition weeks before it's visible to the naked eye.
Golf course management has relied on observation for decades. Turflogic adds objective, continuous intelligence, finding problems before they surface.
Our approachEvery instrument Turflogic uses feeds a single outcome: an objective, continuously updated picture of your course’s health, benchmarked, archived, and actionable.
Open TurfScoreEvery club in the Turflogic network is a live proof of concept, stress found early, interventions targeted, turf health trending upward.
Four health categories, updated after each drone flight. Reveal turf condition weeks before it's visible to the naked eye.
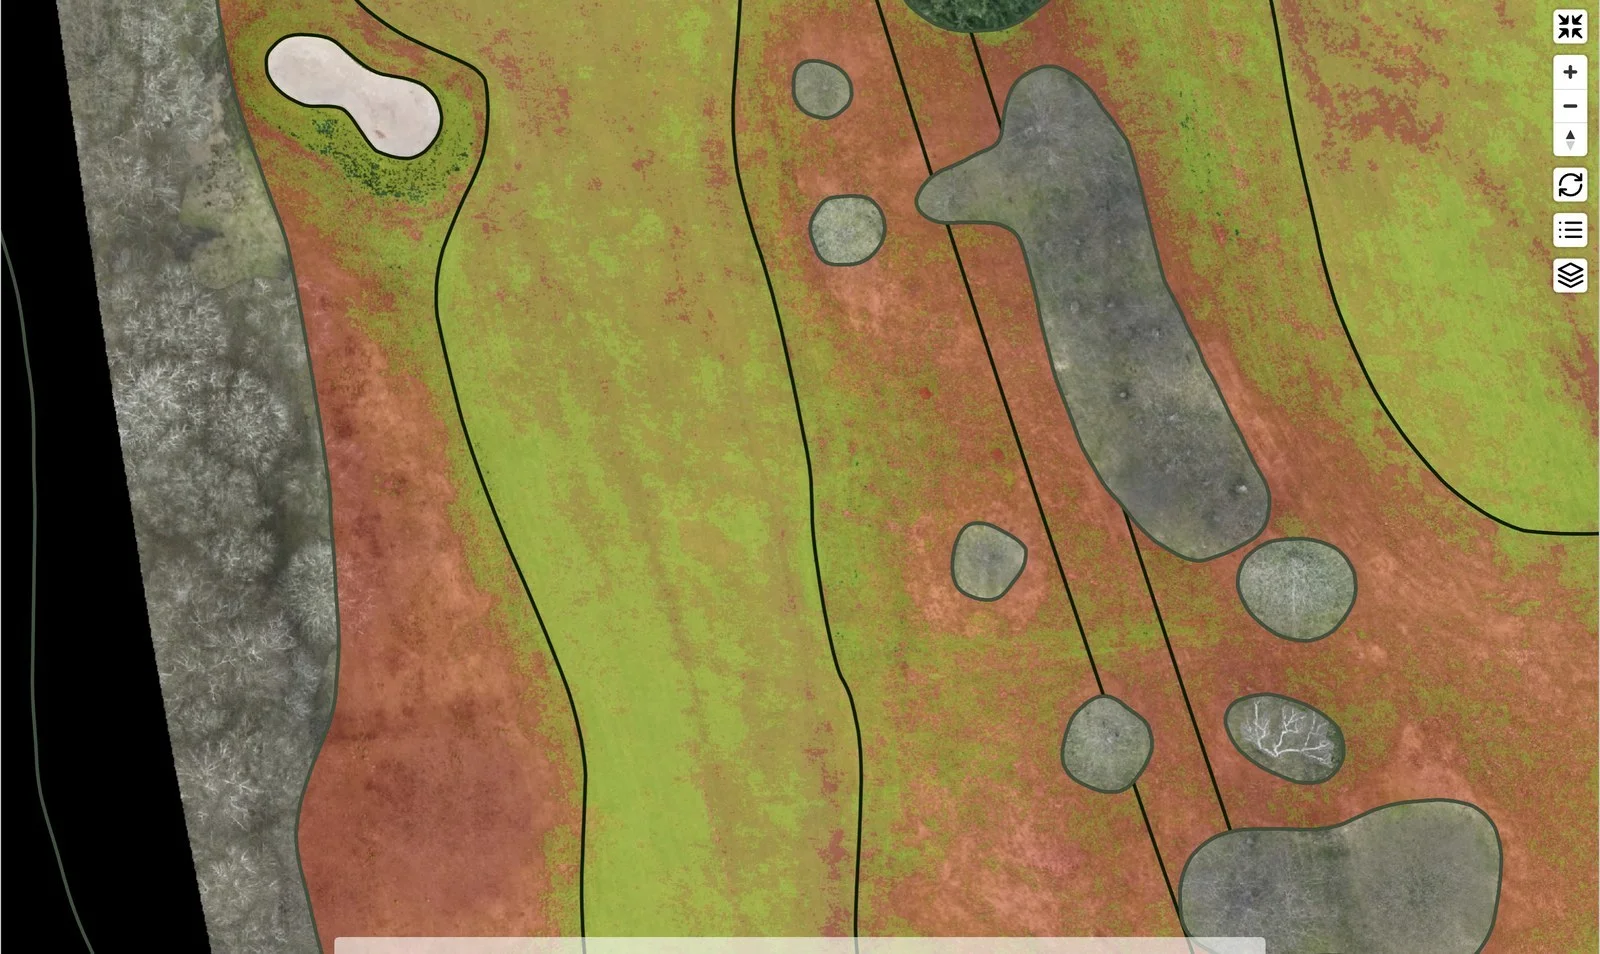
After each drone flight, receive an updated assessment that breaks turf health into four color-coded condition categories across all areas—greens, fairways, tees, rough. Base watering, mowing, and maintenance decisions on real-time data rather than guesswork.
Independently tracked.
Monitor each zone—greens, fairways, tees, approaches, rough—as it exits dormancy and enters growing season. Over successive flights, problem areas become unmistakable: declining collars, underperforming fairway bands, or condition concentrating where traffic and irrigation overlap.
Prepare targeted programs for zones needing attention instead of blanket treatments.
Each map delivers actionable intelligence through three core pressure categories that drive course management decisions.
Identify declining turf before it's visible. Target interventions where they matter most.
Spot conditions exploited by pathogens based on temperature and moisture patterns.
Surface blocked heads, dry spots, and coverage gaps through condition patterns. Measure improvement over time.
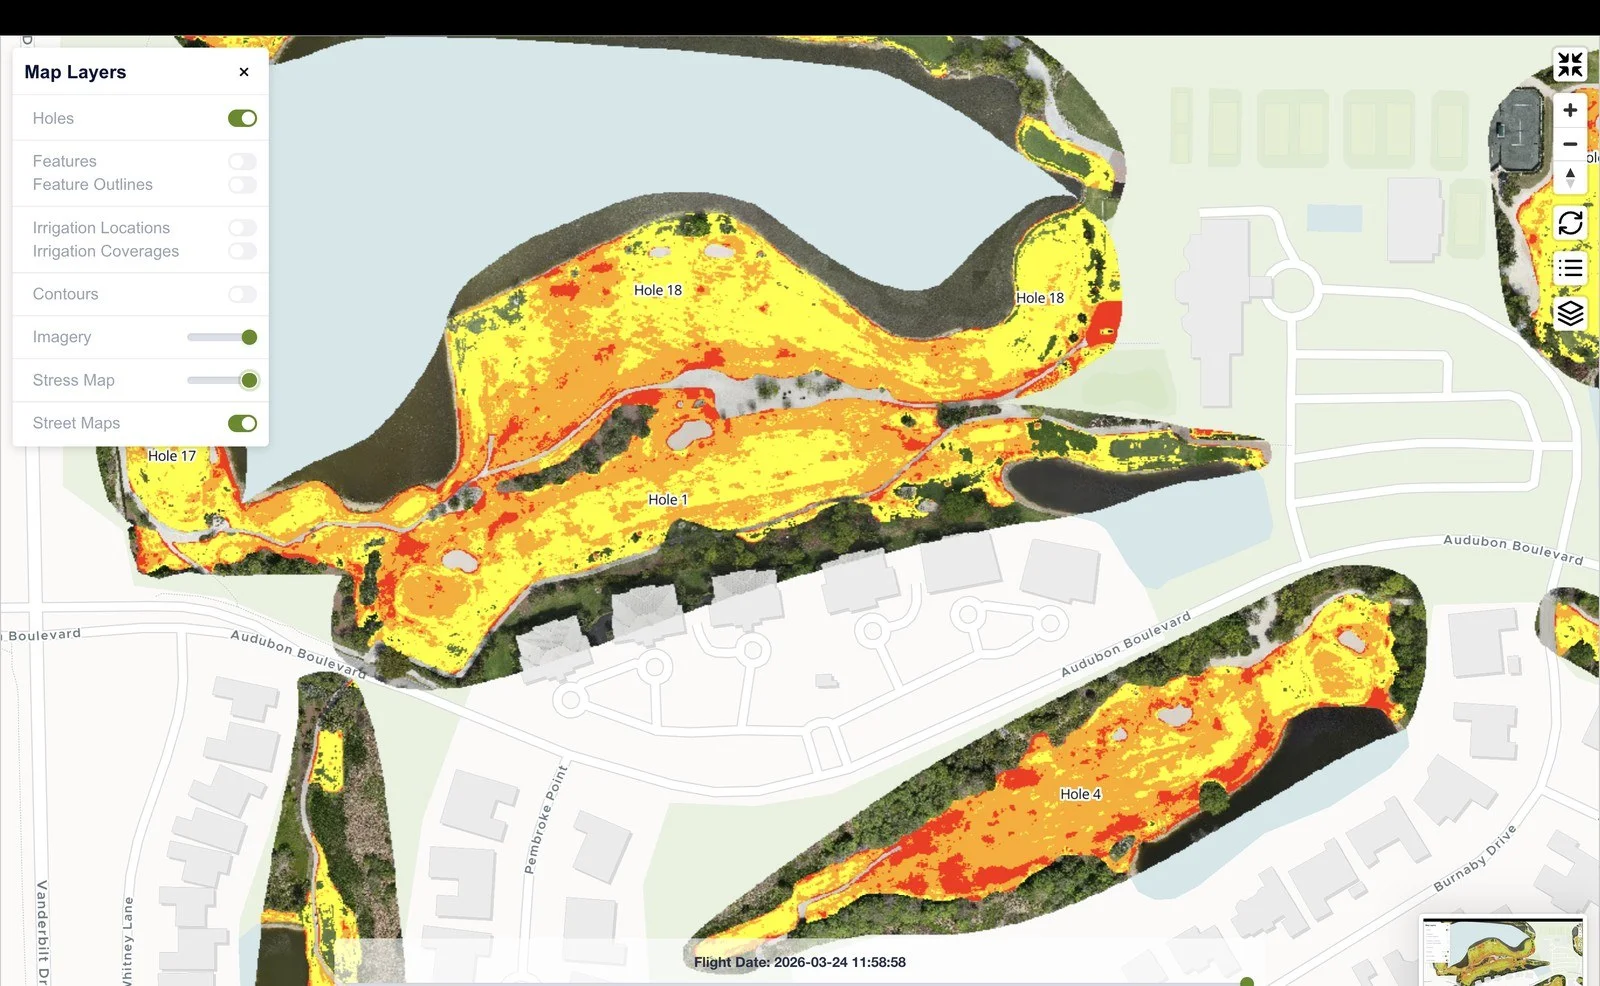
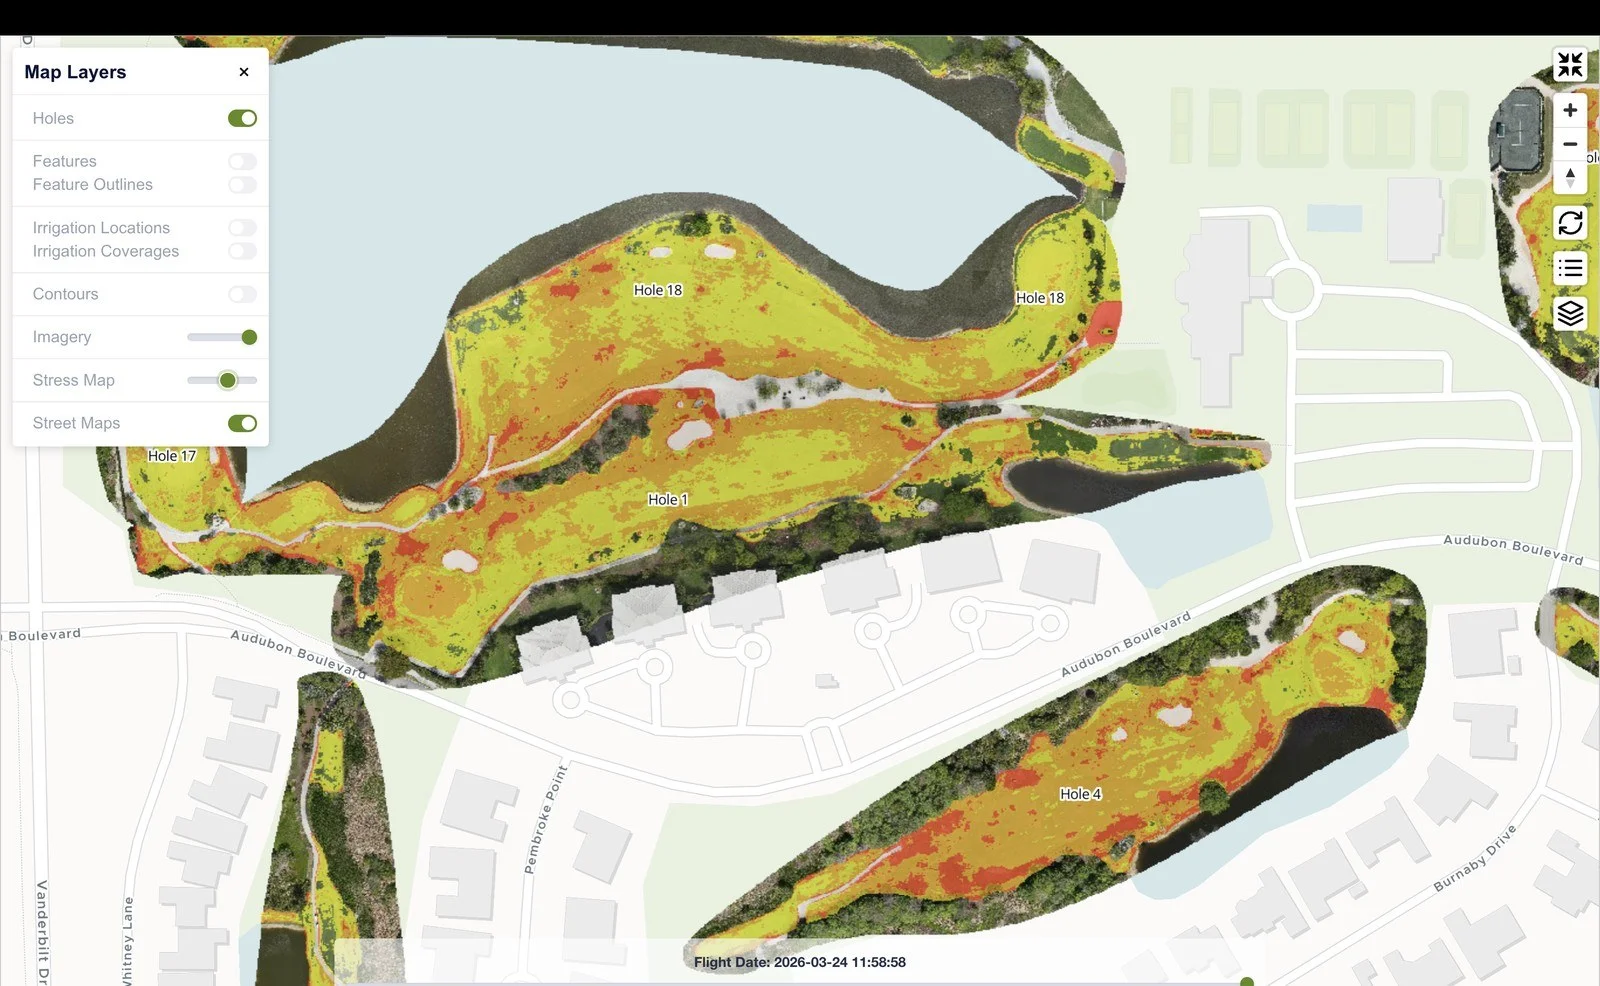
Drag the slider to compare visible light with multispectral data—everything on the right side is invisible to the naked eye.
Tell us your course. We'll show you exactly what a stress map looks like on your fairways, greens, and tee boxes, with your own turf, your own stress patterns.